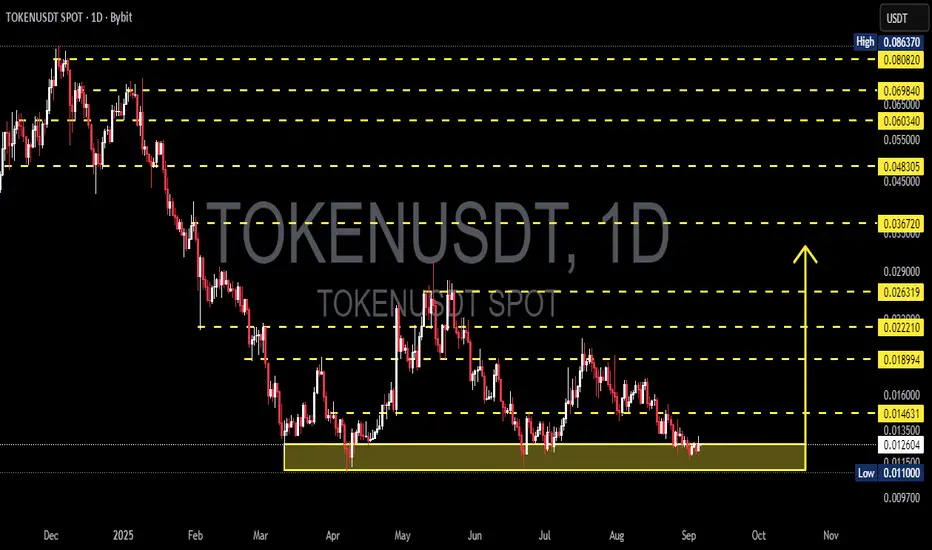
Tokenusdt bottomed outTokenUSDT has continued its downtrend but shows signs of a potential reversal after a sharp decline towards the $0.0043 demand zone. The price has bounced from this level, indicating strong buyer interest. Look for re-accumulation around the current bounce zone and aim for the projected upside targe
TOKENUSDT — This the Start of Accumulation or Anothe Breakdown?Full Analysis
TOKENUSDT is now trading at a decisive area: the major support zone between 0.0110 – 0.0146 USDT (highlighted in yellow). This zone has been tested multiple times since March 2025, making it a crucial demand area. How price reacts here will define the next big move: either a strong re
TOKENUSDT 4H Symmetrial TriangleThe market has reached the end of its consolidation phase. Now the question is whether to break through the resistance or continue to fluctuate around the support and resistance levels.

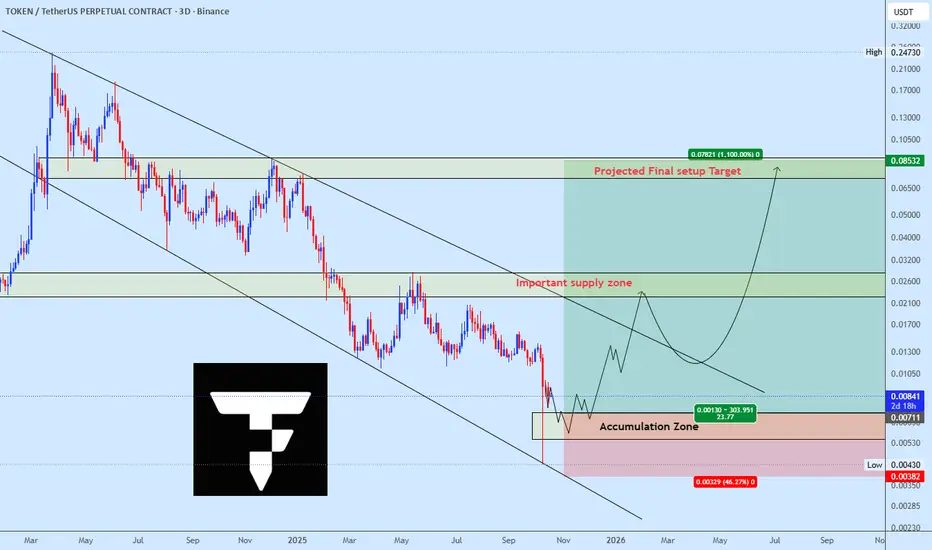
Tokenusdt Buy opporutnityTOKENUSDT appears to have completed an extended corrective structure in the form of a W–X–Y complex. With the pattern now terminating near a well-defined demand zone, the plan is to initiate strategic accumulation from this area. The expectation is to follow the projected recovery path as outlined o

TOKENUSDT Forming Bullish WaveTOKENUSDT is currently displaying a promising bullish wave pattern that is catching the attention of traders looking for steady and reliable gains in the crypto market. The pair has shown consistent volume, indicating strong market participation and growing investor interest. While the expected gain

TOKENUSDT 1D AnalysisTOKEN ~ 1D Analysis
#TOKEN This is the lowest support for now. Buy gradually from here with a short term target of at least 15%+ from this support.

TOKENFIThe 4hr chart is showing a cup and handle has formed. If crypto remain bullish we should see a break through in the next couple of candles and ultimately reaching a 3 cent target before it making even bigger moves

TOKENUSDT 1DTOKEN ~ 1D Analysis
#TOKEN Buy after successfully penetrating this resistant line with a short -term target of at least 10%+ from here.

TOKENUSDT 2DTOKEN ~ 2D Analysis
#TOKEN Buy gradually from here if you still have a Conviction on this coin with a short -term target of at least 15%+.

[Long] TOKENUSDT from Tokenfi. RWA's on the blockchain.Hi Traders,
The swigly line on the indicator indicates a reversal. As you can see on January 30th, 2024 the swigly line indicated a reveral. With Ethereum potentially going up to $4800 you can imagine that TOKEN from Tokenfi will go up to .60 cents or more. Token from Tokenfi will put real world ass

See all ideas
Summarizing what the indicators are suggesting.
Oscillators
Neutral
SellBuy
Strong sellStrong buy
Strong sellSellNeutralBuyStrong buy
Oscillators
Neutral
SellBuy
Strong sellStrong buy
Strong sellSellNeutralBuyStrong buy
Summary
Neutral
SellBuy
Strong sellStrong buy
Strong sellSellNeutralBuyStrong buy
Summary
Neutral
SellBuy
Strong sellStrong buy
Strong sellSellNeutralBuyStrong buy
Summary
Neutral
SellBuy
Strong sellStrong buy
Strong sellSellNeutralBuyStrong buy
Moving Averages
Neutral
SellBuy
Strong sellStrong buy
Strong sellSellNeutralBuyStrong buy
Moving Averages
Neutral
SellBuy
Strong sellStrong buy
Strong sellSellNeutralBuyStrong buy
Displays a symbol's price movements over previous years to identify recurring trends.