RIVN Massive base breakout incomingAbove 19 this will possibly enter into a massive squeeze mode,
The weekly base is enormous and we are finally breaking it.
Worth the watch
Trade ideas

RIVN Finishing up a leading diagonal for the past yearLooks like RIVN just topped out a leading diagonal from the past year, hitting that upper trendline for the top of the 5th wave. The 5th wave has a 3-3-3-3-3 ending diagonal structure as well. Lets tank back down to $10-$12!


Is Rivian Setting Up For a Breakout?Hi Traders!
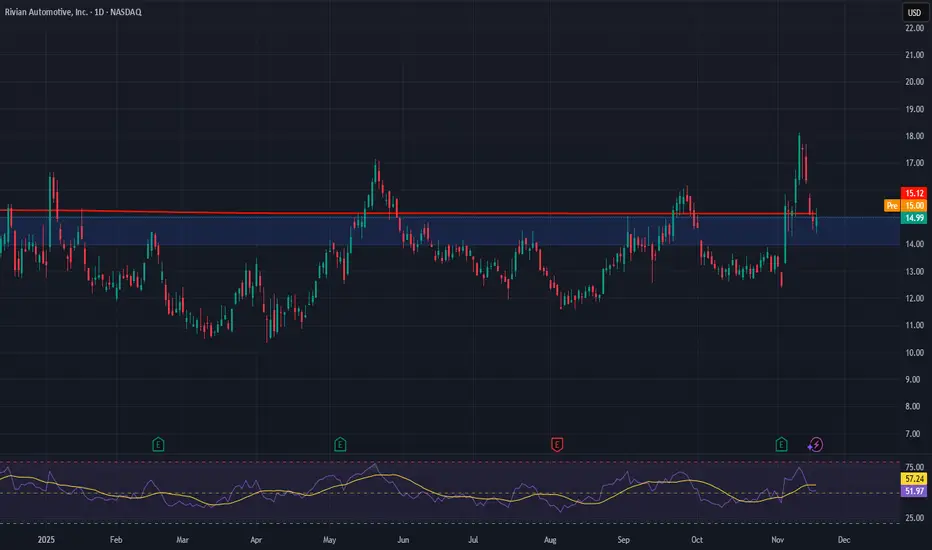
On Nov. 5th, Rivian created a daily bullish CHOCH pushing price to resistance at $18. The following weeks showed price returning back to retest that daily CHOCH. Since then, it looks to me that Rivian is working to complete a cup and handle pattern (Lower TFs).
IMO the daily and weekly look bullish, and Rivian could be setting up to break past resistance at $18. Therefore, my plan is to long swing Rivian to a potential target at $20. My ideal entry would be around/in between $16-$16.50, but when looking at a lower TF $17 area could be respected. Watching closely, and alerts are set!
*DISCLAIMER: I am not a financial advisor. The ideas and trades I take on my page are for educational and entertainment purposes only. I'm just showing you guys how I trade. Remember, trading of any kind involves risk. Your investments are solely your responsibility and not mine.*

Rivian Automotive (RIVN) — Scaling EVs with Software UpsideCompany Overview:
Rivian NASDAQ:RIVN builds adventure-ready electric trucks, SUVs, and commercial vans, giving investors clean exposure to the EV + sustainable transport megatrend.
Key Catalysts:
Record Quarter: 13,201 deliveries in Q3’25; revenue $1.56B (+78% YoY)—evidence of strong demand and improving operations.
Turning the Corner on Profit: First-ever positive gross profit: $24M, driven by cost reductions and a 324% surge in software & services—marking Rivian’s shift toward a software-enhanced platform.
Mass-Market Expansion: R2 at ~$45,000 slated for early 2026, broadening TAM and supporting multi-year volume growth.
Why It Matters:
✅ Proven ability to ramp production
✅ Improving unit economics with software tailwinds
✅ Clear catalyst with R2 launch
Investment Outlook:
Bullish above: $14.00–$15.00
Target: $23.00–$24.00, supported by volume growth, margin improvement, and platform monetization.
📌 RIVN — from premium adventurers to mass-market momentum.
RIVN — Multi-Year Breakout + Fib Expansion Targets
Rivian looks ready to start its first bull run! It just printed one of its strongest technical signals in years: a clean breakout from a multi-year descending wedge on the higher timeframes. This structure has been forming since 2022, and the recent surge in volume confirms that buyers finally stepped in with conviction.
Price has broken above the long-term resistance trendline and retested the zone, holding the higher-low structure that has been building since early 2024. Momentum on the 12H + Weekly charts is aligning bullishly for the first time in a long time.
Key Technical Notes:
Multi-year falling wedge breakout (major structural shift)
12H & Weekly RSI rising from mid-levels (not overbought, room to run)
Bullish divergence on volume as price compressed into apex
Fib extension confluence pointing toward sequential targets
50/200 EMA polarity still overhead on HTF, but weakening as resistance
📈 Fibonacci Expansion Targets (based on breakout leg):
1.618 → ~$19.98
2.618 → ~$24.65
3.618 → ~$29.32
4.236 → ~$32.20
These aren’t guarantees — but they represent the natural expansion zones if Rivian continues to unwind the multi-year downtrend.
🎯 Targets / Areas of Interest:
First Resistance Zone: $19–21
Major Level: $24–25 (supply + 2.618 fib)
Macro Target: $29–32 (3.618–4.236 fib cluster + old breakdown zone)
🛡️ Risk Management:
The bullish scenario remains valid as long as price holds above the breakout structure. Losing the wedge apex or falling back under the horizontal support cluster would signal a failed breakout and shift bias back to neutral.

RIVN the calm before the storm I'm here to guess what the music is gonna
do a week, month, a year from now. That's
it, nothing more....... and I'm afraid...
standing here tonight... that I don't
hear... a... thing... just silence.
How low will she go? 8? I'd a say 14-11 would be a good entry point.
3k at 14
Add 2k at 11
Wait, and wait.. 8 would be the lowest, I'd think, I think as of today

Rivian: Sweet wedge setup with targets above 22 USDI'm currently waiting for the weekly to close definitively above what I believe is an accumulation wedge after the classic Post-IPO selloff. If the breakout gets confirmed on the weekly, I'm expecting a rather fast test of the first real resistance between 22 and 26 USD.
Considering the collapse of Cariad and VWs reliance on Rivians technology, I can also see good things coming long term.
Pretty much, its a strong buy short, medium and long term, if we can close this weekly above the trendline.

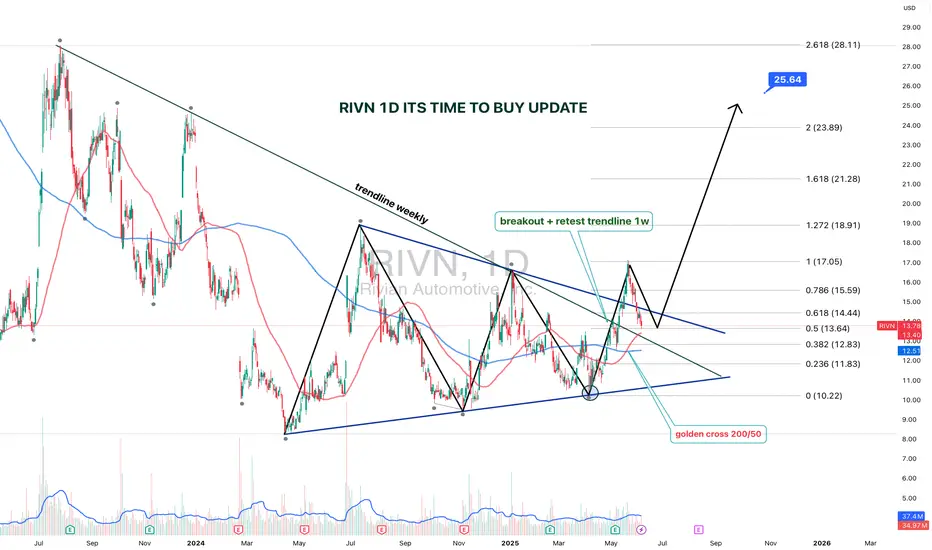
RIVN 1D — It’s Time to Buy: Setup UpdateThe setup on Rivian (RIVN) just got upgraded from “interesting” to “strategically significant.” We’re looking at a textbook symmetrical triangle that’s been developing since July 2023, with a clean breakout and retest on the weekly trendline.
The breakout was followed by a bullish retest, right at the intersection of the triangle base and the key trendline. Volume kicked in, price held — and that’s what smart money calls confirmation.
Now, the Golden Cross is live: the 50-day MA just crossed the 200-day MA from below. Price is confidently holding above both — momentum is shifting hard. Fibs from the bottom (10.22) to the last local top (17.05) project the first target at $17, and the extended Fibonacci confluence gives us $25.64 as a long-range goal (2.618 extension).
The weekly trendline — which acted as resistance for over a year — has flipped to support. Price action respects it, bulls are loading, and structure is clean.
This is not just a bounce. It’s a technical rotation from accumulation to expansion.
The time to talk about potential is over — price action has spoken.
RIVN: Accumulation breaking out with smart money confirmedNASDAQ:RIVN
.
Accumulation breaking out with smart money candle and volume confirmed.
.
US STOCKS- WALL STREET DREAM- LET'S THE MARKET SPEAK!

$RIVN breaking out?Update NASDAQ:RIVN
Still holding my long and monitoring this yellow box. Breakout above on good volume could bring Rivian all the way to $28 zone.

$RIVN – Long-Term Base Breakout Setup + Sector Rotation PotentiaRivian ( NASDAQ:RIVN ) is finally showing signs of life after years of basing out. This is one of those setups that comes along only once every few years — a multi-year base breakout forming as speculative money rotates back into the laggards.
🔹 The Setup:
Big earnings pop ignited the first real move in months.
After that surge, NASDAQ:RIVN has been flagging tightly for 3 days, digesting gains with constructive price action.
The structure here is clean — it’s coiling just under breakout levels, setting up a potential long-term trend shift.
🔹 Macro + Sector Context:
The alt-energy sector is heating up — solars have been leading, and that strength could spill into EV names next.
We’re in a speculative phase of the market where beaten-down names are catching rotation money.
NASDAQ:RIVN fits that bill — it’s been left for dead, but the tape is finally turning.
🔹 My Trade Plan:
1️⃣ Entry: Building a position off the flag near current levels.
2️⃣ Stop: Using the 9 EMA on the weekly chart as my stop — giving it room to breathe.
3️⃣ Account: Tossing this one into the longer-term accounts — not a scalp, this is a swing for the fences type play.
Why I Like It (Even Though It’s a “Turd”):
Multi-year base = massive stored energy.
The chart finally aligns with the macro rotation.
It’s not about loving the company — it’s about recognizing when the cycle flips in its favor.

RIVN - BEEP BEEP & AWAYGood Morning,
Hope all is well. Always trade with risk assessment in mind. Its easy to loose money fast when you do not have an exit plan. With my 7% stop loss rule it guards my portfolio from loss in conditions that are unfavorable and aids in growth when they are.
EV market growth modestly positive in 2026; US auto demand slowly recovers; battery raw-material costs remain near current levels; interest-rate environment moderately restrictive but easing expectations persist.
Rivian execution: vehicle production capacity expansion continues but at gradual pace; software and services monetization progress continues but not yet large-scale; margins improve as mix and scale increase but remain below legacy OEM averages.
Bull scenario (20% probability)
12-month target price: $35–$45
Implied market view: Rivian meets/exceeds production guidance, significantly reduces manufacturing costs, launches profitable higher-margin products (R2 or upgraded fleet), and Rivian Automotive Services (software, subscriptions, fleet services) scale faster than expected.
Key drivers:
Production ramps ahead of schedule — higher volumes and better plant utilization.
Gross margins expand through learning curve, vertical integration, and cost reductions.
Fleet & commercial contracts win (delivery vans, Amazon expansion) improve revenue visibility.
Positive sentiment/EV rotation returns to growth names.
Valuation reasoning: Market multiples for improving-growth EVs expand to ~2.0–3.0x 2026 EV/Sales (or ~12–18x forward EV/EBITDA given margin improvements) reflecting higher confidence in profitability.
Major risks to this scenario: supply-chain disruption, execution misses on new models.
Base scenario (55% probability)
12-month target price: $18–$28
Implied market view: Rivian achieves steady growth aligned with guidance, margins improve gradually but profitability remains distant; revenue growth driven by R1/R1T/R1S volumes, commercial programs ramp slowly, software monetization grows but contributes modestly.
Key drivers:
Production increases roughly in line with current guidance; per-unit cost improvements are incremental.
Gross margins slowly improve toward low-to-mid single-digit operating margins over next 12–24 months.
Cash use continues but is manageable with current liquidity and modest capital raises possible.
Valuation reasoning: Market values Rivian at ~0.8–1.5x 2026 EV/Sales (or 6–10x forward EV/EBITDA) reflecting execution risk and longer path to durable profitability.
Major risks to this scenario: macro slowdown reducing EV demand; slower than expected adoption of services.
Bear scenario (25% probability)
12-month target price: $6–$15
Implied market view: Production problems, materially worse margins, higher cash burn forcing equity dilution or distressed financing; competitive pressure compresses ASPs; fleet deals fall short.
Key drivers:
Larger-than-expected quality or supply issues; production growth stalls.
Margin compression due to discounts and higher input costs.
Need for significant capital raise causing dilution and investor confidence loss.
Valuation reasoning: Market applies deep-discount multiples (0.2–0.6x 2026 EV/Sales) or DCF with depressed revenue growth and higher WACC, implying substantial downside.
Major risks to this scenario: catastrophic recalls, failure to secure next-stage financing.
Probability-weighted central estimate
Using the scenario midpoints and probabilities above yields an approximate 12-month target ~ $24 (rounded). This is illustrative, not a precise forecast.
Key catalysts to watch (next 12 months)
Quarterly production and delivery updates vs. guidance.
Gross margin progress and unit economics disclosure.
New model/R2 announcements, pricing, and launch timelines.
Large commercial/fleet contract wins or losses (e.g., Amazon/enterprise deals).
Cash runway, financing activity, and capital raise announcements.
Macro indicators: EV demand trends, interest rates, and consumer sentiment.
Risks & considerations
High execution risk typical for growth EV manufacturers.
Capital intensity; possible dilution if cash needs increase.
Competitive pressure from legacy OEMs and other EV startups reducing pricing power.
Regulatory, supply-chain, and commodity-price volatility.
Trade Safe
Enjoy!

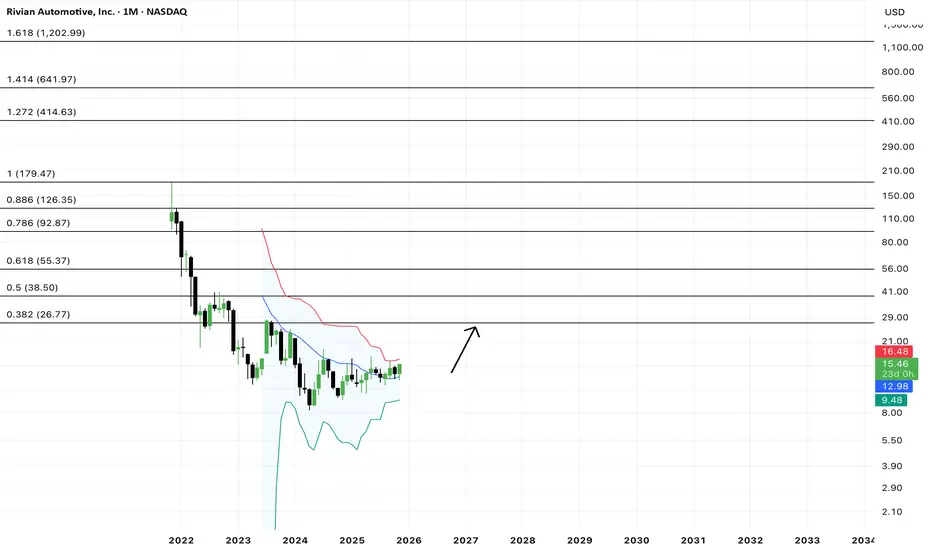
Rivian is botteming out rn The BB are squeezing and are building up a lot of energy.
It's a great risk/reward here imo ,next stop is 0.382.
LT position for sure
77% gain in 6 monthsLooks like selling pressure has subsided. The accumulation period also appears to be nearing an end with markup around the corner. Need to see some sustained volume to confirm, but I’m expecting to see some nice returns by end of Q1 26’.

Is Rivian about to tumble into Bankruptcy? <EV market adoption is saturating, in my opinion. And don’t get me started on environmental benefits with which this whole debacle began. If demand for electric vehicles drop before the environmental “payback” period (when EV use starts offsetting the emissions from production), then:
The upfront emissions from mining and refining critical minerals would still have occurred.
The long-term climate benefits from cleaner driving wouldn’t materialise.
Which means the net effect could actually worsen global warming in the short to medium term, since we’d have massive energy use and emissions from mining and manufacturing,
That's better, get the rant over with sooner than late.
The background
The net zero drive has been incredibly frustrating to watch unfold, a forced movement, without being fully thought through.
The race to the bottom further emphasised as Chinese firms like BYD who are able to undercut almost every other manufacturer, regardless of the production environmental impact. The hypocrisy knows no bounds. Especially as you consider a net zero initiative requires a mass scale solution. How is niche purchasers of mass off road SUVs to contribute to this change?
If you ignore the environmental gesture owners convince themselves on purchase, what would you rather use off-road in a snow covered mountainside? Yeah..
Recently I had an opportunity to share a ride in a 4-5 year old Tesla. It was notable how quickly tech has dated, like last year’s iPhone. It's still good but Meahh. The interior cabin looked like a lost 1990's Starbucks corner where hope went to die and the vacuum cleaner on strike. Do serious coffee drinkers still use Starbucks? Anyway…
The technical
A while back the unpopular idea “ eVTOL manufacturer Lilium on the verge of 80% collapse? ” was published. This annoyed fanboys convinced the Jetsons future would be here any moment.
And collapse it did. The business was drowning in debt, technically weak, spending energy on a product no one wanted. Who on earth wants a flying battery with all the complications that includes when the proven technology of the helicopter and safety record continues to succeed? If it works, don’t fix it. Unfortunately Rivian and their investors din’t get that memo.
On the above 2 week chart, Rivian’s technical setup and fundamentals appear to be converging in a way that suggests significant downside risk. From a chart perspective, the descending triangle pattern, coupled with multiple bearish engulfing candles and a series of lower highs, highlights persistent selling pressure. These are classic hallmarks of a weakening structure. A decisive breakdown from the triangle could, based on prior measured moves, imply a potential ~60% decline from current levels. On the fundamental side, the headwinds are equally stark:
$5 billion in debt,
Negative P/E ratio (~–4.17),
$11 million in monthly interest obligations,
Continued margin pressure in a slowing EV market.
If consumer demand plateaus before Rivian reaches cost efficiency and scale, the company could face liquidity stress or even solvency risk. This risk is amplified by rising competition, particularly from BYD and other cost efficient Chinese EV producers. In short, Rivian’s position in the premium EV niche looks precarious, both technically and structurally.
Conclusions
Rivian, oh, here we go. The electric SUV company that was gonna save the planet. I got those emails periodically in the spam filter. I doubt bankruptcy will stop them from arriving.
Yeah, apparently the world’s going green, right? We’ll all be driving electric trucks up mountains while saving polar bears. Brilliant. Except now they’ve got five billion dollars of debt and owe eleven million a month just in interest. That’s not a company, that’s a bloke with too many credit cards pretending he’s fine.
So yeah, technically, fundamentally, whatever you want to call it, it’s a mess. The chart says ‘down,’ the balance sheet says ‘help,’ and the investors are probably saying, ‘Where’s the exit?’
The only bullish thing left is the optimism of the shareholders. And that’s fading faster than a Tesla interior ;-)
Ww
====================================================
Disclaimer
This analysis is provided for educational and informational purposes only, whilst being a lot more environmentally friendlier than a new Rivian SUV. It represents personal opinions based on publicly available data and technical chart interpretation, not financial advice.
Trading and investing in financial markets involves substantial risk, including the potential loss of capital. Always conduct your own due diligence and consult a qualified financial advisor before making investment decisions.

POTENTIAL FOR A NEAR TERM PRICE EXPANSIONThe lower trend line keeps creating higher highs, if this line holds then we have another rising trend in the near term. The upper band keeps a steady fall, a break above this trendline will see price moving out into a new growth cycle.
Trade safe, good luck

RIVIAN Triangle to give one more rally?Rivian Automotive (RIVN) has been trading within a 1.5 year Triangle pattern, with the price currently consolidating just below both the 1D MA50 (blue trend-line) and 1D MA200 (orange trend-line).
All previous Higher Lows of the pattern have been priced on at least the 0.786 Fibonacci retracement level, which is currently just below or when the 1D RSI approaches the 30.00 oversold level.
As a result, we expect a rebound near the bottom of the pattern, targeting its top (Lower Highs trend-line) at $15.75.
-------------------------------------------------------------------------------
** Please LIKE 👍, FOLLOW ✅, SHARE 🙌 and COMMENT ✍ if you enjoy this idea! Also share your ideas and charts in the comments section below! This is best way to keep it relevant, support us, keep the content here free and allow the idea to reach as many people as possible. **
-------------------------------------------------------------------------------
💸💸💸💸💸💸
👇 👇 👇 👇 👇 👇

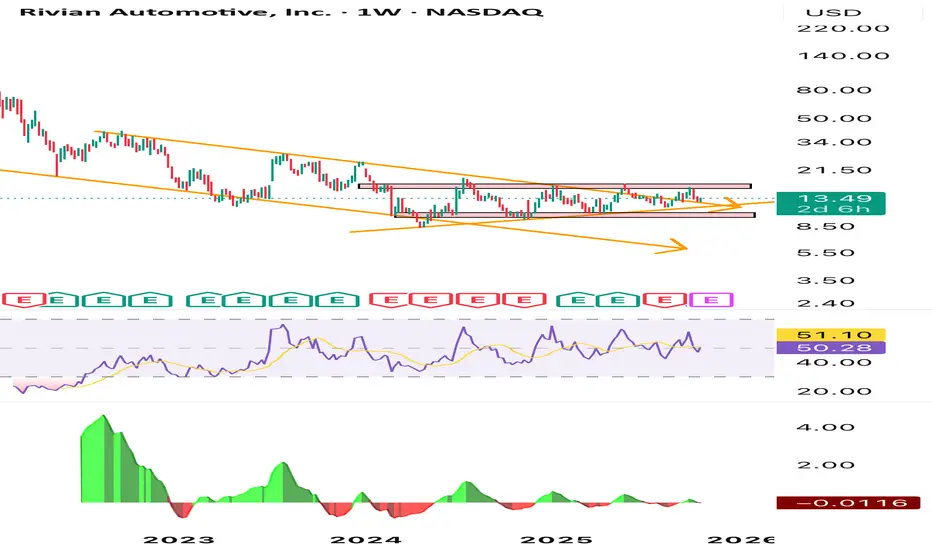
Rivian at a Crossroads: Technical Compression Signals a PotentiaYou’ve clearly identified a descending channel (orange lines) that has contained the stock’s downtrend since its IPO highs. Over time, Rivian’s price compressed into a symmetrical triangle or horizontal range between roughly $10–$16, signaling a classic “consolidation before decision” phase.
• Support: Around $10–11, repeatedly tested and held — forming a potential accumulation base.
• Resistance: Around $16, rejecting multiple breakout attempts.
• Trendlines: The upper descending trendline (orange) has been tested enough times to lose some strength — a breakout above $16–17 would likely trigger a technical rally.
If it breaks above $16 with volume, you might see a measured move target around $22–24, aligning with prior resistance levels.
If it breaks below $11.6, it could revisit $6–7, completing the larger descending channel pattern.
Institutional sentiment tends to cycle around major news catalysts (earnings, delivery updates, or cost-cutting milestones). The long sideways movement may suggest institutional accumulation, waiting for a macro tailwind (e.g., lower rates or positive EV policy incentives).
Option Alert: $RIVN OCT 31 2025 $13 Calls – 109% ROI Potential iEnter: NASDAQ:RIVN OCT 31 2025 $13 CALLS
Buy in Price: $0.67 - $0.67
Take Profit: $1.40
Stop Bleeding: $0.59
ROI Potential: 109%
Exit Within: 232 Minutes

RIVIAN leaving downtrend. Going horizontal or up next?RIVN has some pretty interesting cards right now. The upcoming launch of the R2 is supposed to be a game changer for the company. But only time will tell if this is really the case.
For now at least one could say that the downtrend since it's (overpriced) IPO seems to be done. So next question would be: Are we going into an accumulation for xx months/year or will we start trending up already?
To be honest, I think it's 50/50 here. Nevertheless, accumulating here doesn't seem like a bad decision. As long as we stay above the yearly open, which we are currently retesting, I don't see any issues here.
Let's see how PA unfolds going forward.

Green pastures ahead or bull trap?It appears we may have had a breakout from an inverse head and shoulders and a key level on the weekly chart. Bulls may possibly be gazing at the 17.00 price range; if we can keep prices above the 14.80 range, bulls may have a chance.

RIVN - LongLong entry at 12.76 USD.
Stop loss: 11.19 USD.
1st profit taking: 27.50 USD.
2nd profit taking: 40.00 USD.
3rd profit taking: 66.00 USD.
