BTC.D PlanBTC.D
Entering into the bottom of this weekly parallel channel that’s been going on since 2023. Taking fibs from last cycles ATH to this cycles ATL we see that we almost tapped the .786 before coming down. Taking fibs from the lows of December 2024 to highs of June 2025 we see that the .618, .65, .705 and .786 are all on a weekly OB that is acting as DEMAND. There is a possibility that this acts as support and we get a push off of it. If not, then lower we go, to possibly as low as ~54%.
Trade ideas

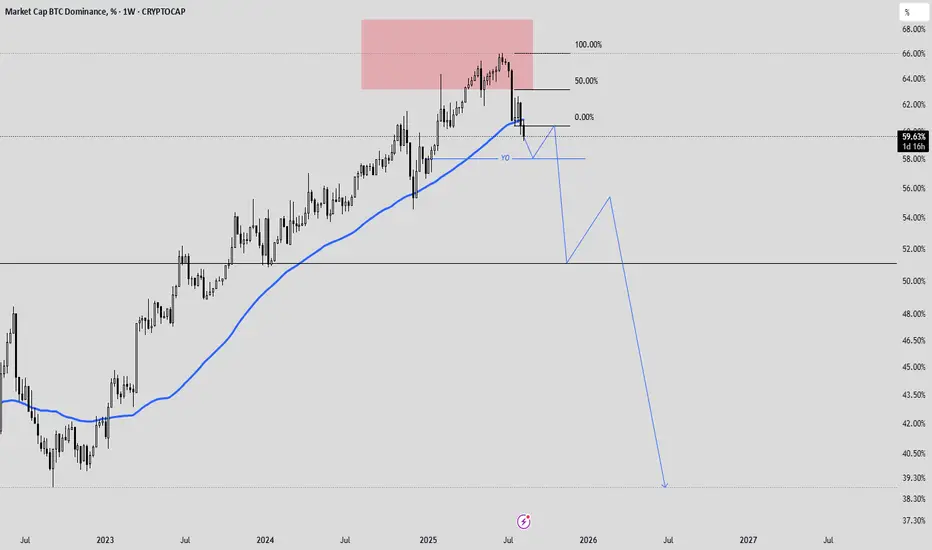
CRYPTO: BTC.D (1W)Currently, we are at a crucial point where the price is playing at the trendline. Once we see a breakout + retest, this is our time to shine! We can see BTC.D hitting targets from 47.06% to 43.68% On the other hand, if the price bounces on the trendline, it may reach to 69% to 73.59%.
I am leaning towards the breakout + retest as of the moment since it is showing clear signs that we are going to see a bull run in the coming months.

Altseason Trigger? BTC.D Test Crucial SupportOver the past two weeks, Bitcoin dominance has lost its upward trendline and is starting to turn bearish. However, for this scenario to play out, the support box highlighted in the chart (drawn using ichimoku) must first be broken.
Breaking this level = the start of Altseason
there are three possible scenarios:
1. A direct breakdown.
2. A pullback followed by a breakdown.
3. Sideway movement within the current range.
We should hope that the third scenario does not occur.
this analysis reflects a personal opinion and is not buy or sell signal.

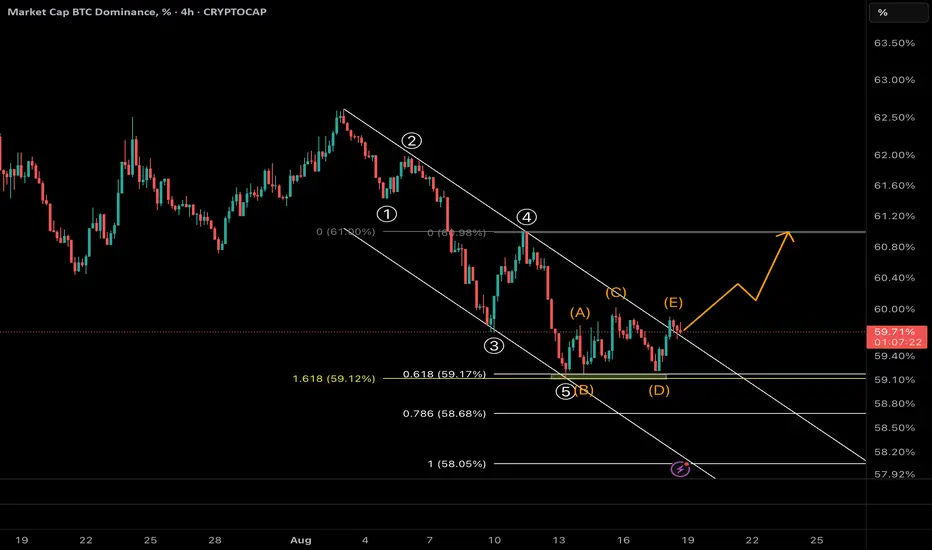
Bitcoin Dominance Breaks Out: Altcoins in Danger?🔎 BTC Dominance (BTC.D) – 4H Analysis
• The 5-wave decline has completed right at the 1.618 Fibonacci extension (59.1%), confirming a potential bottom.
• A contracting triangle (A–B–C–D–E) has formed and just broke to the upside, coinciding with the breakout of the descending channel.
⸻
📈 Main Scenario
• With this breakout, BTC dominance is entering a new bullish phase.
• Next targets:
• 60.8% – 61.0% (key Fibonacci resistance + channel top)
• If broken, possible extension to 61.4% – 62.0%
⸻
⚠️ Implications for Altcoins
• Rising BTC dominance usually means capital is rotating into Bitcoin → leading to heavy sell-offs in altcoins.
• Alt traders should be cautious: this move can trigger a broad correction across the altcoin market.
⸻
📉 Alternative Scenario
• If BTC.D falls back below 59.3%, the breakout may turn into a fakeout, and a retest of lower levels could follow.
⸻
✅ Conclusion:
The breakout above the descending channel is a strong signal of trend reversal. As long as BTC.D stays above 59.3%, the path toward 61%+ is favored. This could mark the beginning of a tough phase for altcoins.
Bitcoin dominance forming a falling wedgeIf we look closely at Bitcoin dominance, it has been sliding from 66% to around 59%, forming a textbook falling wedge. Normally, this is a bullish reversal pattern—and when it plays out, history shows it hurts altcoins the most.
Right now, there’s also a clear bullish divergence on RSI: while the dominance has been falling, momentum is actually climbing. This divergence often signals that a reversal is coming, and when Bitcoin dominance rises, it doesn’t hurt BTC much, but it usually triggers heavy selling pressure in altcoins.
At the same time, USDT dominance is showing signs of heading higher. When these two align—Bitcoin dominance moving up and USDT dominance ticking higher—it sets up a tough environment for alts. Money rotates into Bitcoin, stability is prioritized, and altcoins become the exit liquidity.
In short, the setup is hinting that Bitcoin dominance is preparing to move higher, which could trigger a rotation out of altcoins and potentially cause a sharp correction in the altcoin market. Traders should be cautious—what looks calm in the charts today may flip quickly once dominance breaks out of this structure.

$BTC.D On the Cusp Of Breaking Down - What to WatchNothing too exciting to write home about for the Weekly Closes today, but ₿itcoin Dominance shows continued signs of breaking down, now closing the past 2 weeks below the 50WMA.
If we get one more decisive Weekly close beneath it, I’d feel very comfortable calling Alt Season.
BTC.D is also on the verge of breaking below the 8-year trendline, as well as the 0.236 Fib which would add confluence.
Breaking below 57% should seal the deal.
This will be a big week to watch.
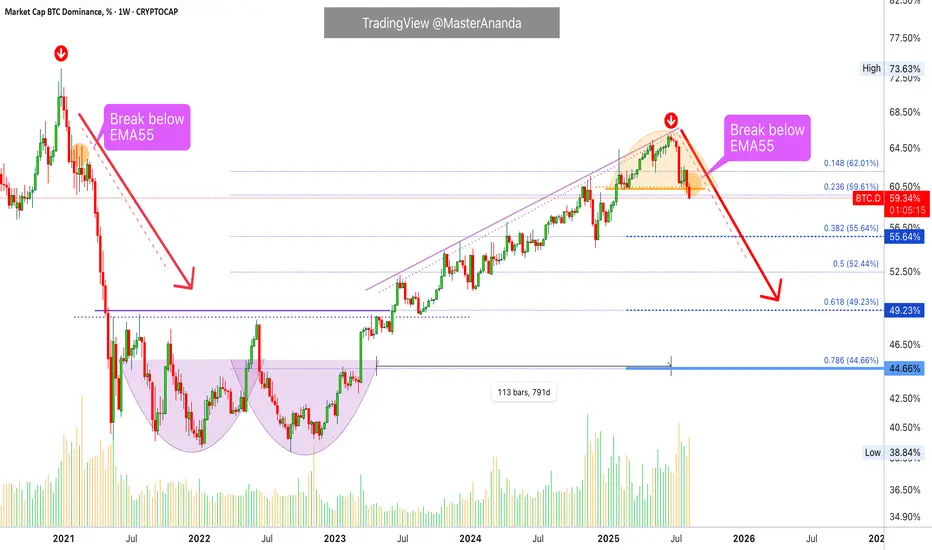
Bitcoin Dominance Below 60% & Below SupportBTCD just lost the 0.236 Fib. retracement support, the next level to be tested immediately is 55.64 followed by 52.44 followed by 49.23. All these are high probability targets.
The week closes today and is red. The chart drawings, patterns and signals are bearish; bearish confirmed, pointing lower and support additional bearish action. Everything points down for this index and the volume is just too strong. The downtrend is on.
The drop is about to intensify next week. Last week was the continuation and this week the confirmation. Now we will experience the meat of the current move. This is when bearish momentum intensifies.
Thinking of the inverse relation between Bitcoin Dominance Index (BTC.D) and Bitcoin (BTCUSD) and the altcoins, this means that the 2025 bull market is about to speed up. We are about to see a massive influx of capital into the market and a large amount of bullish momentum.
Remember, Bitcoin will also grow.
Bitcoin and the altcoins market is going up.
Ethereum will continue growing.
Be prepared, no more red.
(As Bitcoin Dominance goes down, Crypto goes up.)
Namaste.
BTC DOMINANCE New Analysis (4H)Bitcoin dominance is in a bearish trend. After a pullback to the red-marked area, it is expected to drop further, potentially reaching the green-marked zone.
This means that in lower timeframes, money in the crypto market can still flow from Bitcoin dominance into altcoins.
Let’s see how this plays out.
For risk management, please don't forget stop loss and capital management
When we reach the first target, save some profit and then change the stop to entry
Comment if you have any questions
Thank You
Will the water.. fall??I think BTC dominance might have a little poopsie.. Let's see where it ends up on the first 🦵

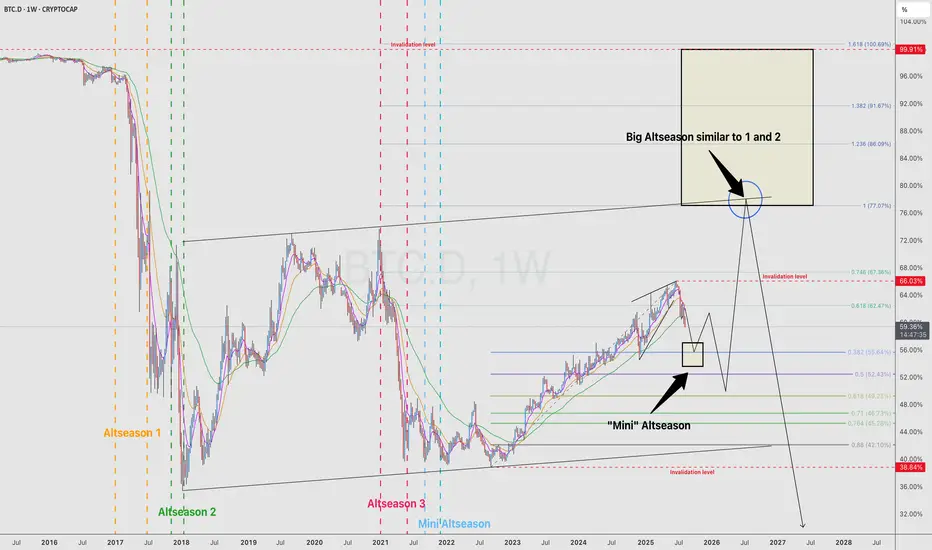
BTC.D, expected roadmap!Hi fellow traders,
On this chart I’m analyzing the Bitcoin Dominance (BTC.D) on the weekly timeframe using Elliott Wave principles.
Looking at the structure, I expect a major corrective phase to unfold in the coming years. Historically, we have seen two big Altseasons (1 and 2), followed by smaller rallies. My projection suggests we could first experience a “Mini-Altseason” when BTC.D enters the lower golden box, before heading higher again.
This move up could then create the conditions for a much larger Altseason, similar in magnitude to the previous major ones, once BTC.D reaches the higher golden box zone.
Mini Altseason: Potential short-term relief for alts as dominance corrects lower into the first golden box.
Big Altseason: A larger, more powerful move, expected after BTC.D completes a strong retracement into the upper golden box region.
The invalidation levels are clearly marked, and as long as the structure remains intact, I expect BTC.D to respect these Fibonacci-based zones and follow this corrective path.
This analysis indicates that while we may see a temporary bounce in BTC.D the long-term outlook still favors another significant Altseason ahead.
Good luck and trade safe!
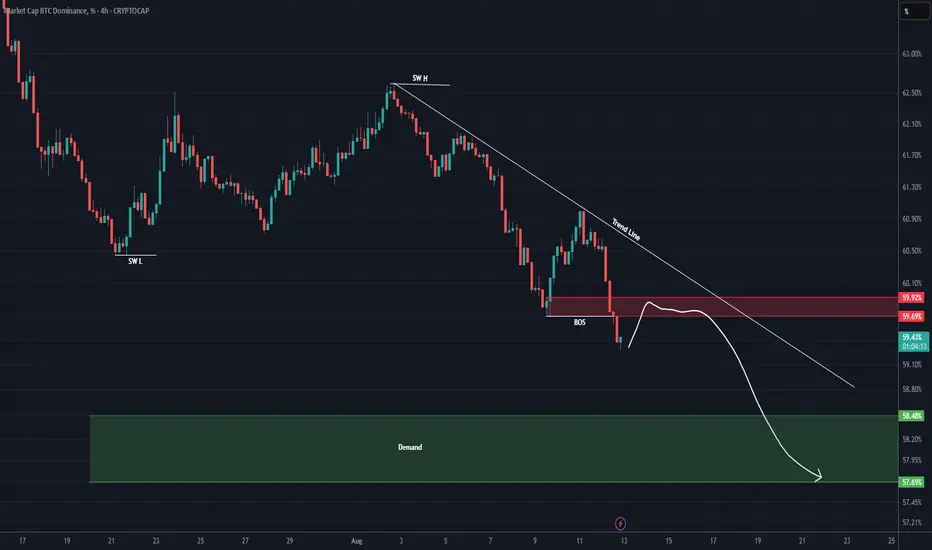
BTC.D 4H#BTC.D has formed a bear flag on the 4H timeframe chart. In case of a breakdown below the flag, the targets are:
🎯 59.30%
🎯 59.08%
🎯 58.86%
🎯 58.54%
📌 As you know, if this gets confirmed and BTC dominance drops, altcoins usually pump. So keep an eye on it.

THE CASTLE WALLS OF BTC, SPX500, NAS100 & GOLD DEFENDEDThis weekend I have analyzed Bitcoin, SPX500, NAS100 and GOLD trading charts and found that the castle walls have been defended by bulls. Yes, intelligence was gathered with bearish signals from last week, however all the selling on these assets was strongly absorbed and I think market sentiment has changed to Bullish on these assets. With this change in sentiment, these markets will likely go higher or at worst battle a tag of war in sideways price action.
I have updated notes on my previous video if you need further reason why I have a change in market direction this coming week. Thank you for spending time listening to my analysis and I wish everyone a profitable trading week. Cheers!!!

Altseason Countdown BeginsThe biggest concern in my head is when to take profits this cycle. Historically, the Dec–Jan timeframe has been best to get out of your bags before the bear erases profits… but I feel more leaned toward using past data relative to the halving instead of exact dates from the halving.
I am looking at BTC dominance currently, comparing it to the 2020 cycle and how it played out. I feel like BTC on its USD pair is almost identical to how it looked back in 2020. In this timeframe, we found a bottom in March and rallied into May, and then consolidated into mid-July. We then rallied and consolidated end of July into August before the historical September dump, followed by the MCT rally.
So to block out all the noise, what does this mean? I feel we will play out the same pattern that BTC had in 2020 on its USD pair, and by looking at BTC dominance during the 2020 March–Sept timeframe, I feel altseason will play out just as it had then, NOW!
By looking at BTC.D during this timeframe, September marked the pivot where instead of dominance dropping, it reversed until topping out in December, before giving us that crazy altseason. I feel since September historically has marked a pivot in BTC.D and a negative month for BTCUSD, we will see a rally in BTC.D just like in 2020, with a top late Q4 of 2025, followed by that altseason rally.
So when do we sell? In this case, I’m looking at the first week of September and marking out the bottom on BTC.D from the first week in Sept to then. This gives us 252 days, which is my main and first target. That would put us from the first week in Sept now into April of 2026, when I believe altcoins will peak. There is another scenario where we can measure out from the first week of Sept to the all-time low of 2020, but I feel it would be irrelevant because the cycle would then have to go on for months longer, which I doubt happening.
So ultimately, I am looking to sell my bags this Dec–January timeframe if I see alts going parabolic and my targets being hit like 5x–10x with BTC.D dropping. But if I don’t see this happening, this will be my exit strategy—targeting the April 2026 altcoin top.

BTC.D LongBTC.D is expected to rise sharply from 59%, aligning with its target within the Order Block zone and following the leg of the Crab pattern.

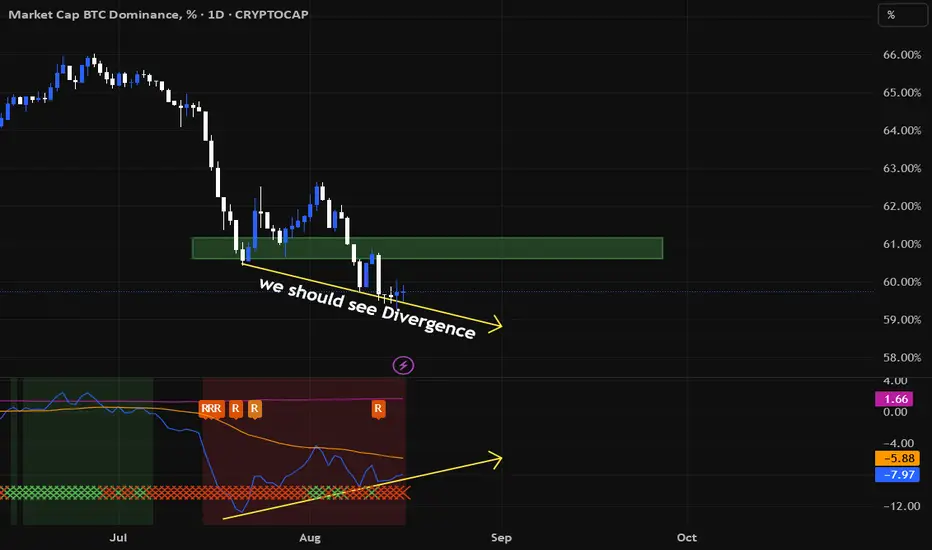
temporary dip in the major altcoinsDivergence in Bitcoin Dominance? Is the Bitcoin ِDominance decline trend reversing? Perhaps a temporary dip in the major altcoins
Btc Dominance Ready to Collapse = ALTSEASONAs you can see, this is the Bitcoin dominance chart on the 1-hour timeframe. A bearish flag is forming, and inside it we can also spot a head and shoulders pattern—both bearish setups. Once the flag breaks down, we can expect a strong altcoin rally that could last 2–3 weeks. So, keep your bags ready, secure profits along the way, and make sure to take some gains before the expected rate cut in September.

#BTC.D Update After PPI NewsDominance dropped perfectly into our yellow zone, and after today’s PPI report we saw a small bounce. Now the big question is:
👉 Is this a reversal or just a retracement?
📊 According to my analysis, this is still just a retracement as long as price remains below the two bold blue lines and doesn’t break above the yellow zone.
✅ Shallow retracement is already done. If the market dips further, price could test Arrow #2 and continue down.
🔥 But if the drop comes from under the blue line at Arrow #3, then we’re looking at a strong, heavy move.
Also, keep in mind:
* A wave structure has formed and price just confirmed it.
* If this confirmation fails, we could see a big reversal.
* Otherwise, we continue the downtrend wave with targets at Arrow #4 and Arrow #5.
⚠️ Today’s move doesn’t mean much — the real momentum starts tomorrow. Patience is key. Let the market show its hand by tomorrow evening before entering the next setups.
💡 Remember: Discipline + Patience = Profits
Stay focused, don’t rush. The big opportunities are coming! 🚀

Bitcoin Dominance and DXY pattern correlation!Is the bitcoin dominance correlated to the DXY?
So far... I think so. Chart pattern wise anyway.
So, according to the DXY, if the Dominance follows this pattern we should be in the biggest altseason to date. But it could be the last one for a while as there could be a 90% to 95% flush out of alts coming.
This would crush all altcoin belief and get rid of all the shit coins. Lets be honest at this point it's needed to flush out all this garbage, it's too much.
Then knew cycle would start over and follow with a massive altseason bigger than anything ever. Don't get excited just yet, it not happen until 2033 or later.
Also according to this chart, dominace can go a bit higher to 72% before it starts to fall. lets see
That's all I have here, I just wanted to put it out here. If you want more analysis on this I have put out a comprehensive video on my tictik and youtube page.
Remember, this is not financial advice.
Kind regards,
Demetrios

ALT SZNThe altseason is starting. I expect a small pullback, followed by an altcoin rally that will last until mid-2026.
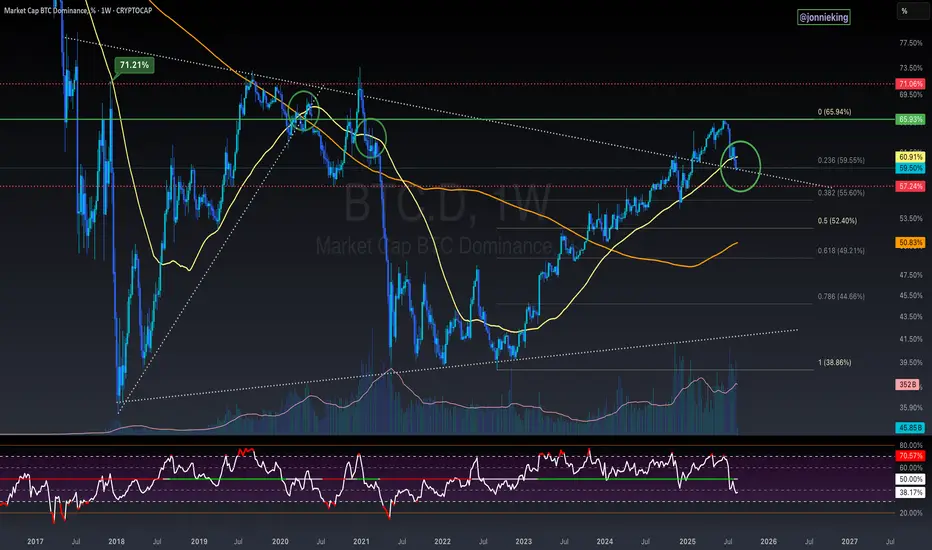
Altseason Signal: BTC.D Breaks 875-Day Trendline !Hello Traders 🐺
As you might guess right now, the moment we’ve all been waiting for is finally here, my dear friends! Ask me why? Let me break it down for you:
On the chart, we can clearly see weakness in the BTC.D chart — and as you know, when BTC.D starts to break below a long-term trend line (and in this case, we already broke below an 875-day uptrend — about 3 years!), it’s a clear sign of altcoin season, my friend.
As you can see on the chart, price is also breaking below the red support box, and if it closes below it, that’s a real bearish sign for BTC.D.

Altseason on the Horizon? Stablecoin Liquidity + BTC.D RejectionOn-chain data is flashing potential early signs of an incoming altseason.
The total supply of ERC20 stablecoins has surged to an all-time high of $128.7B, suggesting unprecedented liquidity parked in “dry powder” form, ready to enter risk assets. Alongside this, active addresses for stablecoins have broken past 250K for the first time in history, underscoring rising network activity and circulation levels typical before major market rotations.
The most notable signal comes from the All Stablecoins (ERC20) Exchange Netflow – Binance chart, which shows sustained positive inflows over recent weeks, often exceeding $67M+ per spike. Positive netflows into exchanges usually indicate increased purchasing power on standby — and Binance, as the largest spot & derivatives venue, is a critical funnel for altcoin liquidity during rotations.
At the same time, the BTC Dominance chart reveals a clear rejection from its Previous Cycle Bull Run Resistance zone. Historically, such rejections have coincided with capital flowing from BTC into mid and large-cap altcoins, marking the early to mid phases of altseason. Supporting this, Ethereum active addresses have risen sharply to 450K+, near cycle highs, positioning ETH as the likely lead driver of altcoin market momentum.
Conclusion:
The confluence of record-high stablecoin liquidity, Binance-dominated net inflows, surging on-chain activity in ETH, and BTC.D’s technical rejection collectively strengthen the case for a potential altseason breakout. Key confirmation would come if ETH breaks above its This Cycle Bull Run Resistance with strong volume while BTC.D continues its downward trajectory. Until then, these signals warrant close observation as capital positioning appears to be shifting under the surface.

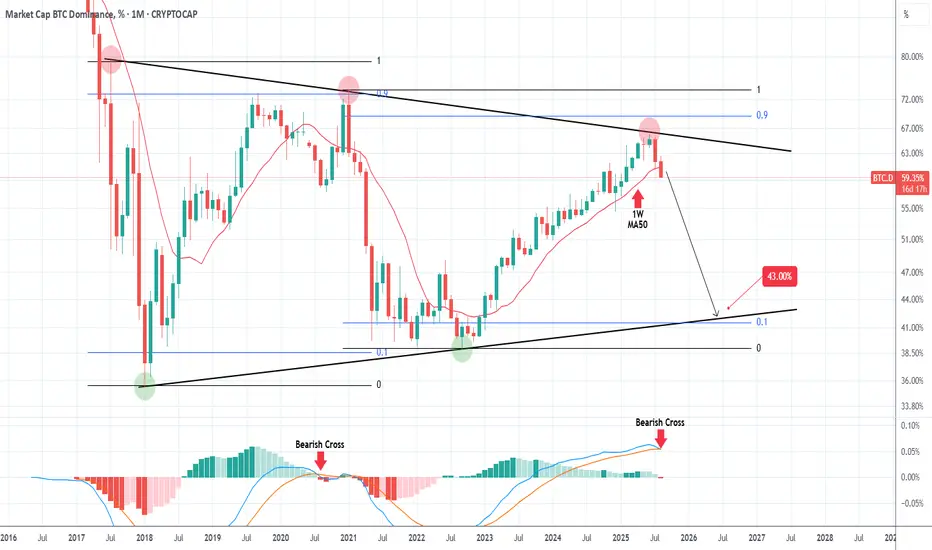
ALTSEASON has already started!The BTC Market Cap Dominance (BTC.D) has made an emphatic rejection at the top (Lower Highs trend-line) of the 8-year Triangle and if it closes the 1M candle of August below the 1W MA50 (red trend-line), it will largely confirm the new Bearish Leg.
With the 1M LMACD about to complete its first Bearish Cross in more than 4 years, it is more probable to see this strong and lengthy downtrend target the bottom (Higher Lows trend-line) of the Triangle near the 0.1 Fibonacci level, similar to the previous one.
The Target is 43.00%.
-------------------------------------------------------------------------------
** Please LIKE 👍, FOLLOW ✅, SHARE 🙌 and COMMENT ✍ if you enjoy this idea! Also share your ideas and charts in the comments section below! This is best way to keep it relevant, support us, keep the content here free and allow the idea to reach as many people as possible. **
-------------------------------------------------------------------------------
💸💸💸💸💸💸
👇 👇 👇 👇 👇 👇