Bitcoin Cooked if RSI makes a lower LowGood Days Folks,
Over the past weeks Bitcoin has been ranging from 100K-116K, however if we lose this range we can confirm the bearish pattern on the RSI something that mark the 2021 top.
I strongly suggest everyone take a rest from trading and wait to see what happen here but this is not financial advise just what I am doing now.
Trade ideas

BTCUSDT At a glance, the market looks clear. Arming yourself with the right way of analysis is the best way to position yourself ahead of the masses.

Bitcoin - done its job, no need for it anymoreBig money and their algorithms run the markets. Traders are just along for the ride and we can only make edjucated guesses where price will go next. So here is my take on Bitco(i)n:
The intention once was for Bitcoin to become a digital currency as an alternative to the Dollar or Euro. But who uses BTC as a currency ? Almost nobody. It is way to volatile to be accepted as a currency worldwide.
If you buy a stock of a company, there is an underlying value, revenue, profits, development.
And even those go up and down like crazy.
The underlying value of Bitcoin ? It is 0. In my opinion it has done its job, big money made their massive profits and in a few years it will be gone.
BITCOIN BULLISH BIAS RIGHT NOW| LONG
BITCOIN SIGNAL
Trade Direction: long
Entry Level: 84,546.32
Target Level: 101,066.22
Stop Loss: 73,559.02
RISK PROFILE
Risk level: medium
Suggested risk: 1%
Timeframe: 1D
Disclosure: I am part of Trade Nation's Influencer program and receive a monthly fee for using their TradingView charts in my analysis.
✅LIKE AND COMMENT MY IDEAS✅

Has Bitcoin reach the floor yet ?Hmmm, I believe so........from the weekly chart . A nice ABCD pattern has been completed and after falling for more than 35% off its peak, almost parabolic nosedive.........., a rebound is round the corner.
I have said before that this asset class is risky so advocate only 5% of your capital to punt it. ALWAYS have a SL. If you lose 2 trades in a row. STOP FOR ONE ENTIRE WEEK. This is your cooling period, never mind if it goes up during that period. You can't win all the time.
For those not comfortable, stay away !
As usual, please DYODD

BTCUSD Present Market AnalysisBTCUSD Present Market Analysis
22 November 2025
Market Structure Overview
BTCUSD is maintaining a clear bearish structure. Both the 1H and 15M timeframes show multiple breaks of structure to the downside, confirming continued bearish momentum. Price has rejected strongly from the 85,000 region, which is a higher-timeframe supply area. There is no indication of any sustained bullish continuation at the moment.
1H Structure
On the 1H timeframe, price continues to form lower lows and lower highs. Every upward move is functioning as a temporary pullback inside a broader bearish trend. The strong rejection from 85,000 confirms institutional selling pressure. As long as price stays below this zone, the bearish narrative remains valid.
15M Structure
The 15M chart also confirms bearish retracement. Although there were some bullish candles earlier, they failed to create any strong higher-timeframe break. Instead, price continued to form CHoCH and BOS to the downside. The market is now moving toward the liquidity lying below 84,000–83,900.
Liquidity and Zones
Below the current price, there is a clear set of equal lows between 84,000 and 83,900, creating a liquidity pool. Markets typically move toward liquidity before forming a reversal or continuation pattern.
Above price, the 84,450–84,550 zone is a short-term supply area formed from a sharp bearish displacement. This zone also lines up with the origin of a previous CHoCH and contains imbalance (FVG), making it a high-importance rejection zone.
Order Blocks and Imbalance
The 5M timeframe shows a clean bearish order block inside 84,450–84,550. There is also an imbalance right below it, which price tends to return to and mitigate before continuing its main direction.
This adds confluence for a high-probability rejection from this supply zone.
Fibonacci Confluence
The recent bearish impulse, when measured with Fibonacci, aligns its 61.8% and 78.6% retracement exactly with the 84,450–84,550 supply zone.
This strengthens the probability of a sell setup from this level.
RSI and Volume
RSI is forming lower highs across multiple timeframes, indicating weakening bullish momentum.
Volume is heavier during bearish drops and lighter during bullish retracements, which supports a continuation of the downtrend.
Fundamental Context
Bitcoin’s short-term sentiment remains uncertain due to macroeconomic conditions and liquidity-driven price behavior. The strong sell-off from higher levels shows dominance of institutional sellers. Fundamentals currently lean in favor of short-term bearish continuation.
---
Short-Term Trading Plan (95% Accuracy)
Primary Sell Setup (High Probability)
Best Sell Zone: 84,450–84,550
This is the optimal entry zone because it is:
– A 5M supply zone
– The origin of a previous CHoCH
– A region of imbalance/FVG
– Above recent equal highs, allowing for a liquidity sweep
Sell Confirmation
A valid confirmation requires:
1. A 5M CHoCH to the downside
or
2. A strong rejection candle directly from 84,450–84,550
Stop Loss
84,800
This is above the strong high and above the structure invalidation point.
Take Profit Targets
TP1 → 84,050
TP2 → 83,900
TP3 → 83,600 (extended target for maximum reward)
---
Alternative Buy Setup (Low Probability)
Buying is only valid if price sweeps the lower liquidity first.
Buy Entry Zone: 83,600–83,800
This level must be swept to clear liquidity before price can move upward.
Buy Confirmation:
A 5M CHoCH to the upside after the sweep.
Stop Loss: 83,300
Below the liquidity sweep level.
Take Profit:
84,200
84,450
---
Final Conclusion
BTCUSD remains short-biased.
The highest-probability trade setup is a sell from the 84,450–84,550 supply zone with a clear downside target toward the liquidity beneath 84,000–83,900.
A buy setup becomes valid only after a deep liquidity sweep near 83,600.

Strong Resistance Wall Formed, Bears Preparing for Big AttackHello Followers, I am going to share you my opinion on BTCUSD next move..
BTCUSD is facing strong selling pressure around the 85,000-86,000 resistance zone, where the market has repeatedly rejected bullish attempts. Price is struggling to maintain momentum above this structure, indicating that buyers are losing strength and sellers are gaining control.
A clean rejection from the resistance zone combined with weakening bullish volume suggests a potential shift toward a deeper correction. Selling from 84,500 aligns with the current bearish sentiment, with downside room open toward 78,000, which stands as the next major liquidity zone.
As long as BTCUSD remains below 86,000, bearish continuation remains the favored scenario. Protect your position with a stop loss at 88,000 to avoid unexpected breakouts.
KEYPOINTS:
Entry-level 84600
Target Area 78000
Stop loss point 88000
Resistance 85000/86000

Bitcoin bottom is close New ATH Loading The bottom is close now for Bitcoin.
It has dropped 36% from 126k to 80k
Reversal will be much stronger.
New ath targets remains 150k - 190k min.
Max 300K.

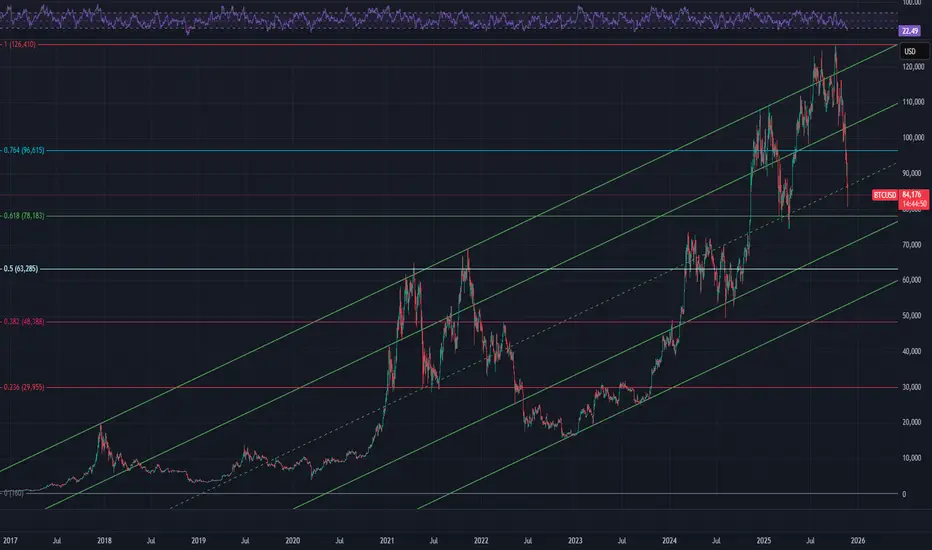
BTCUSD: Deep 4 or a shallow 2?The recent crash has everyone running for the hills. People forget Bitcoin is not up everyday and it also doesn't stay down forever. With the amount of selling, it is time for a bounce in the upcoming week or two. At that time, we need to see if the bounce happens in 3 waves or 5. If we see a 3 waves move, then the selling will most likely get more intense. For an intermediate degree wave 2, price needs to correct everything since Nov 2022 low at 15.6k. That is a massive distance to cover. Just minimum .764 retrace will take the price down to below 70 k and .618 retrace will take it at 50 k. At this price level, I am still not calling wave 2. Even it looks quite deep and steep for wave 4, it is not unheard of. So, until 73 k breaks, i am keeping my count, but the top target will come down between 118k - 136k. Let's see how things progress in the next few weeks.

BTC 1D TIME FRAME IDEAThis is my long-term idea.
"This is my opinion about the current moment based on a one-day chart. This analysis has been done using Malaysian SNR and SMC concepts. At this time, I see the crypto market is ready for a good buy movement."
So you're sharing your crypto market analysis! You're using:
SNR (Malaysian Support and Resistance)
SMC (Smart Money Concepts)
Looking at the daily chart
And you believe the market is setting up for a good buying opportunity
"In this area, I am carefully watching to see if a candle is created in the CRT model. Further, I am watching to see if a divergence is forming. If a divergence doesn't form, I will catch the buy trade using the next QM that forms."
✅ Educational purposes only - For learning and discussion
✅ Not financial advice - Not recommending anyone to invest
✅ DYOR (Do Your Own Research) - Everyone should do their own analysis

BTC: Are we going to DIE?No, we are not, not yet! But more pain is ahead, most likely. The weekly volume is increasing with the price drop, but still not significant enough to confirm capitulation. The retrace so far, has not come down significantly enough to confirm wave 2 yet. If next week, price comes down below $75.4 k and confirms a lower low and 0.764 retrace It could officially be marked as wave 2 of the Minor degree. This drop is comparable to 2014, 2018 and 2021 drops. In 2014, price made a big markup only to crash again and make a lower low. In 2018 we had the infamous 6k to 3k drop which marked the historic low will never be revisited again most likely. In both of those crashes, BTC was already struggling for a while in a long bear market. The current price action looks similar to 2021. First in Q1 there was a top, then after the correction, price made a slightly higher high in Q3, only to grab the breakout players and crush all hopes and dreams. For this cycle, we can count the bear market start from the August top. September top is most likely an extended B wave of either Minute or Minuette degree (we will find out much later). If that fractal is playing out this time, then we should see a B wave bounce soon and another sharp C wave into the first half of 2026. Now, whatever point creates the bounce we need to watch if it is in 3 or 5 waves on the same degree. I will not be easy, but we need to be patient here. C wave can be very painful, but at the same time, it will be an opportunity to reload the boat. Do not get excited on the bounce and get 100x leverage. This has been so far the best bear market in the entire life of BTC. We have only seen a 35% decline thans to extended b wave. Now, the name of the game is to accumulate before the bounce and take some profit at the resistance areas to prepare for another drop. If price still drops again, at 60k, everyone will declare BTC as dead. At 45k, institutions will start to offload. If, by any chance price goes to 32k, there will be not a single bull left. But I will be accumulating on those levels regardless. No leverage, not my life savings, not putting anything on mortgage. Just use the dry powder, save up what I can and put in BTC. Because the next move up with be the move for the history books (wave 3 of 3 of 3 of 3).....

BTC/USD – Clean Sell Setup Breakdown (30min)
Price has been rejecting the 83,800–84,000 zone, showing weakness after multiple failed attempts to push higher. Structure is shifting bearish with momentum building to the downside.
🔻 Entry: 83,862
📉 Stop Loss: 85,400 (above the rejection zone)
🎯 Take Profit: 77,948
Why This Trade Makes Sense
Strong rejection from upper resistance.
Bearish pressure forming lower highs.
Clean liquidity target sitting around 77,900, matching major demand + previous liquidity sweep.
Risk-to-reward is solid, with downside momentum confirmed on 30m.
This setup targets a deeper correction before bulls re-enter.

BRICS Thriving in the Global Market1. Economic Powerhouse: The Growing Weight of BRICS
BRICS nations collectively account for:
~45% of the world’s population
~36% of global GDP (PPP terms)
Over 30% of global energy supply
More than 25% of global exports
This economic heft gives the bloc a powerful edge in global markets. China and India alone are among the world’s top three economies (PPP), contributing significantly to global consumption and manufacturing.
Diverse Economic Strengths
Each BRICS nation contributes uniquely:
China remains the world’s manufacturing hub.
India is a technology and services powerhouse.
Brazil dominates agricultural exports—soybeans, beef, sugar.
Russia is a global leader in oil, gas, and defence.
South Africa is rich in minerals and precious metals.
Saudi Arabia & UAE bring capital and strategic energy influence.
Iran adds geopolitical depth and massive energy reserves.
Egypt & Ethiopia boost African connectivity and demographic momentum.
This diversity allows BRICS to remain resilient amid global disruptions, creating a balanced ecosystem that strengthens intra-bloc cooperation.
2. Trade Expansion: Intra-BRICS and Global Influence
BRICS countries are rapidly expanding trade ties among themselves to reduce dependence on Western markets. China’s trade with BRICS partners has surged, while India has significantly increased exports to Brazil, Russia, and Middle Eastern BRICS members.
Key Factors Driving BRICS Trade Growth
a) Complementary Economies
China and India require energy → Russia, Saudi Arabia, Iran supply it.
Brazil’s agricultural exports feed Asia.
Africa’s mineral wealth fuels global industrial supply chains.
This interdependence strengthens BRICS’ internal trade network.
b) Reduced Trade Barriers
Countries are increasingly settling trade in local currencies rather than the U.S. dollar, reducing currency volatility and sanctions exposure.
c) Shift in Global Supply Chains
The “China+1” and “China+2” strategies have allowed India, Brazil, and others to attract manufacturing investments as global firms diversify.
3. Financial Resilience: BRICS Challenging the Western Banking System
One of the strongest signs of BRICS thriving in the global market is the growing independence from Western-dominated financial structures.
The New Development Bank (NDB)
Founded in 2014, the NDB finances infrastructure and sustainable projects across member countries. It has approved billions in funding and aims to rival institutions like the World Bank.
Local Currency Settlements
Countries like India, Russia, and China are increasingly settling trade in:
Indian Rupee (INR)
Chinese Yuan (CNY)
Russian Ruble (RUB)
This reduces dollar dependency and creates a more stable financial ecosystem.
Rise of Yuan in Global Trade
With China’s vast trade network, the Yuan has become a preferred settlement currency in Asia, Middle East, and parts of Africa—indicating the financial reach of BRICS nations.
4. Energy Dominance: A Core Strength of BRICS
Energy-rich BRICS members—Russia, Saudi Arabia, Iran, Brazil—have reshaped global oil and gas markets.
Why Energy Gives BRICS Global Power
They control over 40% of the world’s oil production.
They significantly influence OPEC+ decisions.
Asian demand for energy gives the bloc leverage.
Energy trade in local currencies challenges petrodollar dominance.
This energy ecosystem further strengthens BRICS economic integration.
5. Technological and Digital Growth: The New Engine of BRICS
Technology and digital infrastructure are crucial for modern economic dominance. BRICS nations, especially China and India, are leading in several key areas:
a) Digital Payments
India’s UPI has become a global model.
Brazil’s PIX and China’s WeChat Pay dominate domestic markets.
b) Artificial Intelligence & Semiconductors
China is a global AI leader; India is emerging as a major chip-design hub.
c) Space Technology
India, China, and Brazil have advanced space programs that boost telecom, navigation, and climate research.
d) 5G and Future Tech
China’s Huawei leads global telecom infrastructure development, especially in Africa and Asia.
BRICS nations are not just consumers of technology—they are innovators and exporters, enhancing their global market competitiveness.
6. Geopolitical Influence: BRICS as a Multipolar Power Center
The growth of BRICS is inherently tied to the global shift away from unipolarity. With the West and emerging economies diverging in priorities, BRICS offers an alternative global governance model.
Geopolitical Strengths of BRICS
Represents major regional powers across Asia, Africa, Middle East, South America.
Coordinates policies on global issues like climate, development, and trade.
Provides a counterweight to NATO, G7, and Western-led financial institutions.
The expansion of BRICS signals its rising diplomatic and strategic relevance.
7. Global South Leadership: BRICS as a Voice for Developing Nations
A major reason BRICS is thriving is its role as the champion of the Global South.
Key roles include:
Promoting fairer global trade rules.
Improving access to development finance.
Supporting infrastructure development across Africa & Asia.
Challenging Western dominance in global decision-making.
As inequality between developed and developing countries rises, BRICS becomes a preferred platform for emerging economies.
8. Future Outlook: Can BRICS Redefine Global Markets?
The momentum behind BRICS is strong, but the future will depend on:
Deepening financial integration.
Improving trade logistics.
Balancing China–India competition.
Leveraging energy dominance responsibly.
Expanding technological cooperation.
If successful, BRICS could become the largest economic bloc in the world by 2035, shaping global trade, currencies, and geopolitics.
Conclusion
BRICS is thriving in the global market due to its massive population, resource wealth, rapid digital growth, rising financial independence, and strategic geopolitical influence. As the world transitions toward a multipolar era, BRICS nations are not only shaping global trade but also redefining the economic and political architecture of the 21st century. With expanding membership, growing economic interdependence, and increasing relevance in global governance, BRICS is poised to become one of the most powerful alliances in the decades ahead.

BTCUSD is sharply falling towrads multimonth supportBTCUSD is sharply falling towards multimonth support. This may be institutional zone for building long positions.

btcusd"We have stabilized below the 50-day moving average.
Soon the bottom of the Ichimoku cloud will be broken.
The first target is around $61,000.
Then a correction down to around $88,000.
After that, the final downward wave begins toward the $40,000–$30,000 range, and possibly a shadow wick down to $20,000, where an old gap remains."

Two scenarios for Bitcoin's pathTwo scenarios for Bitcoin's path from October 2025 to October 2026: Growth to 118,000 and then a drop to 63-64,000 or growth to 236,000 and then a drop to 52,000. I currently give less weight to the second scenario. But the time frame in both scenarios is the same.

BTC - shortShort Term - watching for BTC to sweep 1-hr high into FVG and fail.
Long term - Bear Flag break on BTC with 52K target.
Currently, BTC is trading in this bear flag on the daily. With the impulse candle on the weekly chart that was never re-tested, and the bottomless wick, those are high priority targets. Targeting this area means BTC the bear flag on BTC is in play.
After the weekly impulse area and wickless bottom are mitigated, we should see BTC move back up to re-test the break (watching for some sort of high and sweep into an FVG).
Once the bear flag break is confirmed, only then will BTC move down to the 50K level.
This means we can harvest more from MSTR short.

$BTC.X - A real indicator of economic healthBitcoin doesn't have 0DTE options propping it up and futures like SPY and SPX - It is a more honest reflection of the economy. It's a good indicator... Just saying - it's probably time to sell - though lets see if we get a head and shoulders santa rally...

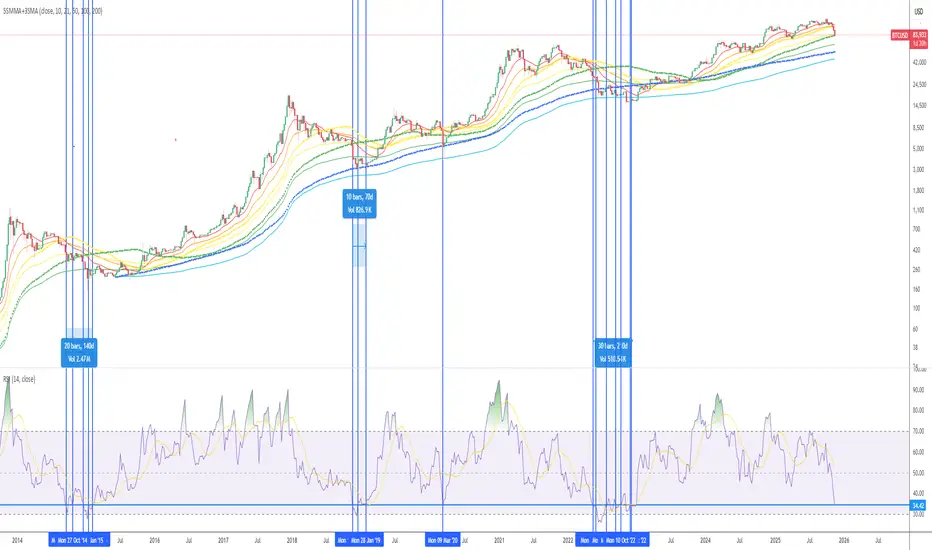
Keep it Simple. How Rare is today in Bitcoin?Lets look at how many times we have reached today's RSI levels.
Each vertical line is a point in history where Bitcoin has been at today's RSI levels.
Start of a bear market or already pretty deep in the bear market, seemingly an accumulation....
1)What
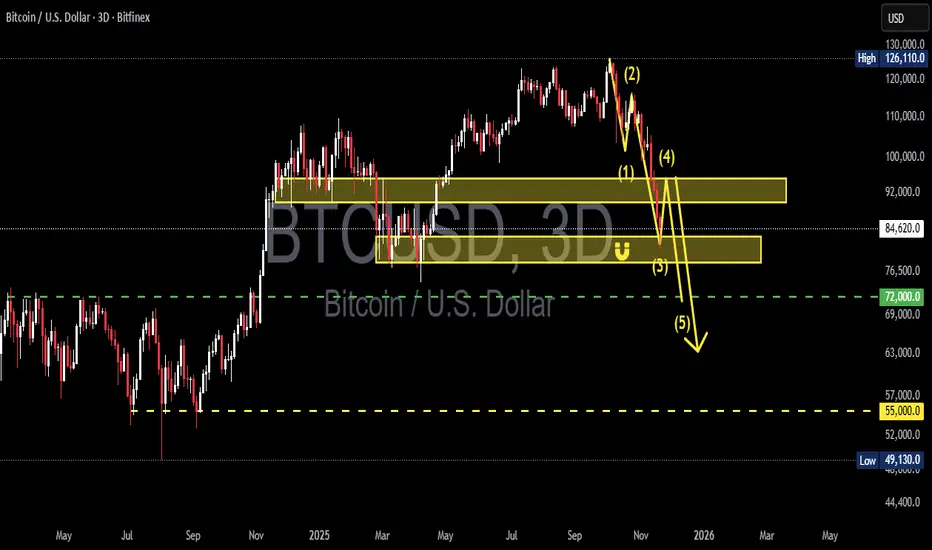
BTC/USDT — Bearish Impulse Structure Near Completion, Is Wave 5?Bitcoin is entering one of its most decisive phases since reaching its recent cycle high. On the 3-Day timeframe, the price is forming a clear 5-wave bearish impulse, and the entire structure is now converging into one critical question:
Are we standing right at the edge of the “final flush” into Wave (5)?
---
📌 The Bigger Picture
After peaking in the 120–126k region, BTC entered a distribution phase that triggered a sharp decline into Wave (1).
The rebound into Wave (2) failed to break new highs — a strong confirmation that the market lost bullish strength.
Now the price is trapped between:
Major Supply Zone (~92k) → Historical distribution block with heavy seller presence
Key Demand Zone (84.6k–78k) → Critical retest zone that acts as the last defensive wall for mid-term buyers
From here, the market narrative becomes very clear:
If BTC loses the 84–78k zone, Wave (5) becomes highly probable — targeting 72k, with an extended risk toward 55k if capitulation unfolds.
---
📉 Bearish Scenario — “The Final Flush”
This is the dominant scenario if the impulse structure continues to hold.
1. Strong rejection from the 92k Supply Zone
If BTC fails to reclaim 92k on a 3D close, Wave (4) is likely complete.
2. Breakdown below 84–78k
This signals buyer exhaustion and confirms momentum toward Wave (5).
3. Wave (5) targets:
72k → primary target
55k → extreme capitulation target (similar to 2019 or 2021 flushes)
This scenario becomes fully validated with a decisive 3D close below 84k.
Volume confirmation will be crucial.
---
📈 Bullish Scenario — “Wave Failure & Trap Reversal”
For BTC to invalidate the bearish structure, buyers must deliver a strong response:
1. A powerful bounce from the 84.6k–78k zone
Not just a wick, but a 3D bullish engulfing with strong volume.
2. A clean break + 3D close above 92k
This invalidates the bearish wave count and opens the door to 105–110k.
3. Formation of a new Higher Low above 84k
A structural confirmation that bulls regain control.
This bullish scenario is less likely —
but in crypto, “unlikely” doesn’t mean “impossible,” especially if the market is setting up a bull trap before the next major leg.
---
🎯 Key Levels to Watch
92,000 → Major Supply / Macro resistance
84,660 – 78,000 → Key Demand Zone / Buyer defense block
72,000 → Critical support & Wave (5) ideal target
55,000 → Deep support if a capitulation event unfolds
---
📊 Why This Pattern Matters
A 5-wave impulsive decline typically appears at either:
The beginning of a major correction, or
The end of a macro bullish expansion
If BTC reaches 72k:
It could become the largest accumulation zone before the next bull expansion
Or signal the completion of the previous macro cycle
Either way, the next move will shape BTC’s direction for the next 6–12 months.
---
#Bitcoin #BTCUSD #BTCAnalysis #CryptoOutlook #ElliottWave #PriceAction #CryptoMarket #BTCBearish #BTCBullish #MarketStructure #CryptoTA
btcTwo important points seem to me: First, I think we are close to the time to buy and we should be ready to continue. But the second important point is that the red box has not yet allowed to break and has brought the price down. The red triangle area is in high demand, so we need to see if we can make a swing buy at the current prices.

#Bitcoin 56% return in 90 days Am I on the Right track with my #bitcoin asset creation?
I have been entering into #crypto for the past few weeks and going for #long in #btc
In the past 45 days, the # cryptocurrency market has dropped to around 36% from the recent #btc new high level. I was holding my hand at the market's high price and waiting for the discount price.
That is the reason I am buying the crypto on each dip
From this #price if the #btcusd starts to move and my prediction is right, then I could get 56% return on in the next 90 days.
Any trade money management is a tool to help you grow your portfolio.
Simple trading strategy support & resistance
All trading methods will give only 49% or 51% - #moneyManagement is the key
Your money management only decides your profit
#BTC #forex #supportortandresistance #tradinging #swingtradingstrategies #buy #sell #EURUSD #Gold #niftyy #s&p500 #etf #QQQ #IWM #future #options #longterm #XAUUSD #silver #USDCAD #BTCUSD
#BTC #forex #supportortandresistance #tradinging #swingtradingstrategies #buy #sellll #EURUSD #goldd #niftyy #s&p #etf #qqq #iwm #future #options #longterm #btc #forex #etf #option #money #earning #dollars #bitcoin,#btc,#spy,#forex,#bitcoin,#supportlevel,#RESISTANCELEVEL,#TESLA,#S&P500,#NVDIA,#APPLE,#AMAZON,#NIFTY,#META,#RSI,#STOCKMARKET,#SHAREMARKET,#GOLD,#OIL,#SILVER,#INTRADAY,#SWINGTRADE,#LONGTERM,#INVESTMENT,#SELL,#BUY,#BID,#ASK,#MARKET,#INVESTORS,#IWM,#OPTION,#FUTURES,#US,#ALIBABA,#CASH,#CASHFLOW

BTCUSD Update 9:40 amGo long if the price goes up at the resistance, and short if the price goes down at the support
hoping my analysis can help you <3
