Trade ideas

#BTC Continues Deepening Correction?📊#BTC Continues Deepening Correction?
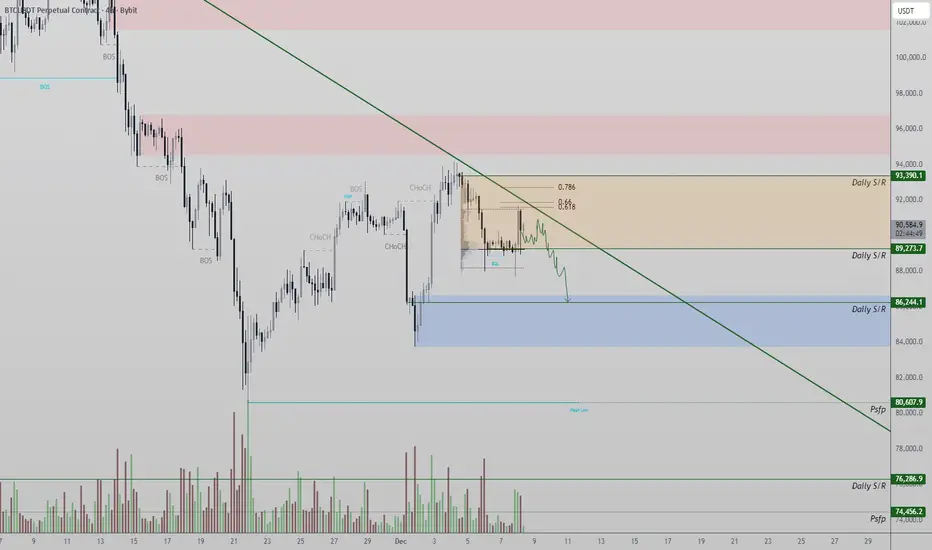
🧠From a structural perspective, we are still in a daily-level correction phase, with a short-term downtrend. Therefore, until a bullish structure is established within the same timeframe, we need to be wary of further pullbacks. We can only maintain an optimistic outlook after reversing the blue resistance zone.
➡️Therefore, short-term support is around 85358. If we continue to break below the low L, then we need to pay attention to the next support zone at 69000-74500.
Let's see 👀
🤜If you like my analysis, please like 💖 and share 💬
BITGET:BTCUSDT.P

BTCUSDT - The Top (3x) I am looking at $75k-$80k for a bottom with 3 potential topping targets, the last macro sized pump for 'the cycle'.
Target 1 ~$108k
Target 2 ~$144k
Target 3 ~$173k
I put the least weight in Target 1 at 10%, with 40% for Target 2 and 3 a piece.
As to when these targets hit, I am thinking 2nd week to 3rd week of January 2026 to coincide with the seasonal 'January Effect'
As always, this could be completely wrong. So as always, hold strong opinions, but hold them loosely.

BTC - Bulls Watching the Channel Support!📈Bitcoin remains overall bullish, trading cleanly inside its rising channel. Each dip toward the lower bound has acted as a strong springboard for the next impulsive move, showing clear demand from buyers.
⚔️As BTC approaches the lower trendline of the channel and the green demand zone, we will be looking for trend-following longs. This confluence area has held multiple times and continues to act as a key decision point for market structure.
🏹As long as BTC remains above this zone , the bullish scenario remains intact, and another push toward higher highs becomes the most likely outcome. Only a break below the demand zone would weaken the bullish outlook.
Now it’s all about the retest… will the bulls defend structure once again? 🤔
⚠️ Disclaimer: This is not financial advice. Always do your own research and manage risk properly.
📚 Stick to your trading plan regarding entries, risk, and management.
Good luck! 🍀
All Strategies Are Good; If Managed Properly!
~Richard Nasr

Bitcoin Price Apex Zone, Directional Move this week?BTC is sitting above a key level at $90,000 after rejecting from the 0.618 Fib, which aligned with the value area high and dynamic trendline resistance.
This confluence has pushed price back into an apex zone where consolidation is likely.
Key Points:
- Rejection at 0.618 Fibonacci + value area high
- Dynamic trendline continues to cap upside
- Price compressing inside an apex, watching for a break
What to Expect:
As long as dynamic resistance holds, BTC risks a decisive downside break once the apex completes. Bulls must reclaim resistance to shift momentum.
BTC/USDT Weekly AnalysisBitcoin is currently in a corrective phase after a strong weekly sell-off.
Price has a clear Weekly Fair Value Gap (FVG) sitting around the previous weekly high in the 95k–97.5k area.
📌 Technical idea:
Price could retrace back into the weekly FVG to rebalance inefficiency and grab liquidity above the previous weekly high.
After tapping that zone, a bearish reaction is expected.
Final target is the previous weekly low, where major liquidity rests.
📍 Key levels:
Weekly FVG zone: 95,000–97,500
Liquidity grab above previous weekly high
Target: previous weekly low around ~75,000
🎯 Bias: Bearish after mitigation

BTCUSDT – Bullish Retracement Toward Supply ZoneMarket Structure:
Price has been in a short-term bearish structure, making consecutive lower highs and lower lows. Multiple CHoCH and BOS events confirm active redistribution phases.
Liquidity Zones:
• A large demand zone (highlighted in orange) sits around 90,900 – 91,200, where price recently reacted and swept the weak low liquidity.
• Above current price, a clear supply zone / strong high is marked at 92,300 – 92,500, which is the main upside target.
Recent Price Action:
Price dipped into the demand zone, swept liquidity, and produced a bullish CHoCH, signaling a possible short-term reversal. The blue-circled area marks the initial rejection and shift in character.
Expectations:
If bullish momentum holds:
• Price may form a higher low, push upward, and aim for the mitigation of the supply zone at 92,300 – 92,500.
• This region represents the TARGET and a potential reaction zone for sellers.
Invalidation:
A break below the weak low would indicate continuation of bearish structure and invalidate the upward target.
Bias:
Short-term bullish retracement toward supply, within a broader bearish context.

BTC Keep buyingBTC's short-term upside momentum has started to slow down but the overall uptrend remains intact. Stick to the long strategy 100K is our first target
I send accurate signals every day and we've had two straight weeks of profits dont miss out

Bitcoin – Technical + Fundamental Analysis
📊 Technical Situation
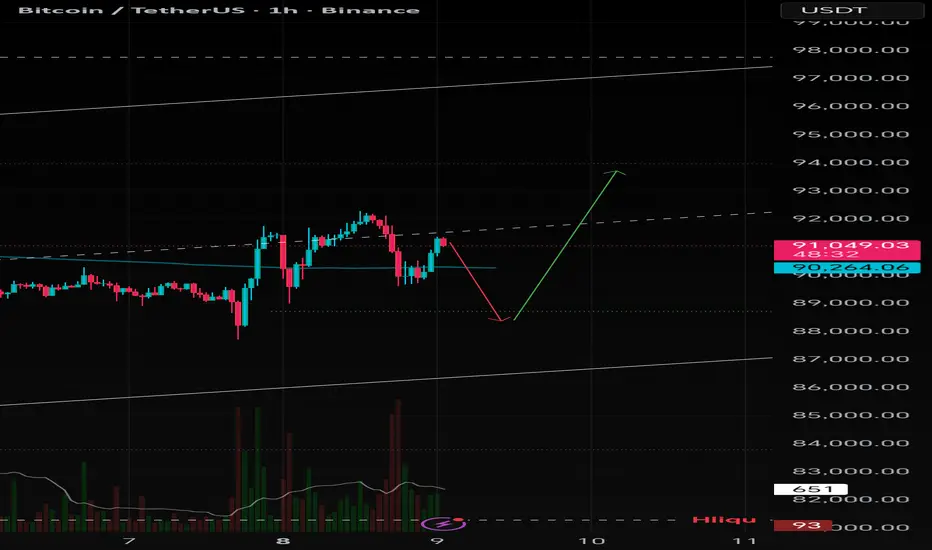
BTC remains inside its bullish ascending channel, with lower boundary still holding well.
Yesterday, price failed to break above the channel’s mid-line / resistance, suggesting consolidation is needed.
A drop toward the lower boundary of the channel could provide good liquidity and a support zone for a bounce.
If that support holds, price could attempt a new upward swing targeting ~94,000 USD, assuming resistance is overcome.
🌐 Fundamental Context
Risk sentiment remains shaky: as traditional markets show volatility, crypto tends to follow — higher Treasury yields and macro pressure have weighed on Bitcoin recently.
On the other hand, medium-term tailwinds remain: growing concerns over global money supply and potential monetary easing support Bitcoin as a hedge against inflation and currency debasement.
Institutional flows remain a mixed factor: while some investors are reducing exposure, others view dips as opportunities — this could generate volatility, but also strong rebounds if sentiment flips.
🎯 What I Expect
Ideally, BTC corrects toward the channel floor before resuming upward — this sets up a buy-the-dip opportunity.
If macro conditions worsen (rising yields, global risk-off), expect pressure toward lower channel support or even deeper.
If support holds and yields/market sentiment improve, Bitcoin could push toward 94,000 USD or higher.

BTCUSD - D11. Completed 5-Wave Decline
The downtrend from the triple-top region completed like this:
(1) bearish impulse
(2) corrective rally into BOS breaker block
(3) extended wave — largest impulse
(4) weak correction respecting trendline
(5) final capitulation into massive liquidity BUY zone (blue)
Your chart correctly marks the final liquidity sweep, which forms the foundation for reversal.
This 5-wave completion is the strongest indication that a trend reversal is starting on D1.
2. Liquidity Grab + ChoCH = Reversal Confirmation
At the bottom:
Price swept deep liquidity under the entire October–November structure.
Then formed a ChoCH (change of character) upward.
This is the D1 first sign of bullish strength.
Smart money accumulated in the blue zone → now initiating the markup phase.
3. Current Price Action – Ascending Structure Forming
Price is building:
A bullish wedge / re-accumulation structure
Multiple higher lows
Price breaking the internal descending trendline
This matches exactly the pattern drawn on your chart.
4. Expected Move (Based on Your Projection)
BTC is likely to follow a two-leg bullish cycle:
🔹 First Target Zone: 100,000 – 102,500 (Supply Zone)
This is the first major D1 supply, created during Wave (4) & internal bearish OB.
Expect:
A reaction
A short-term pullback
Possibly forming a higher low around 95,000–97,000

BTC-USDT
The 2-hour chart has reached its short-term support at 92,800 📌
If this level is broken,
it's likely that the correction could continue down to the psychological support at 90,000 dollars, which is natural after the good growth it had 📉💸
The next upward move will happen when the red resistance is broken, in that case, it could go up to 95,900 🔼✔️

BTCUSD TO 100K!!!!!!BTCUSD made a breakouts off my internal structure highs yesterday without any valid pull back to the breaker block after my inducement am taking a long buy entry at 92k holding till price sweep liquidity at 100k which will be my next sell zone order

Short term higher, then lowerIt looks like a possible short term move back up, then selling continues.

My view
***Price will drop to the green line.** That’s my key support level.
* **Then it will bounce back up.** I expect a reversal after touching that green line.
***The overall trend is still up.** The big white uptrend line at the top shows the main direction hasn't changed yet.
***It’s a pullback, not a crash.** This dip to the green line is just a normal correction before the next move higher
BTC 88194.99K the point where time bows before structure Carved in Stone: The Point Where Time Bowing to Structure
🏷 BTC
🏷 17.11.2025
🏷 Capital Sector. Local price slice at a moment. System of intelligent anticipation.
🏷 88194.99 — The price is carved. As of publication, the level has not yet been reached.
November 17, 2025 — not a date, but a portal .
Within it, as within an ancient temple, the number is inscribed: 88194.99 . Not approximately. Not “around.”
Carved — without room for interpretation, without space for opinion.
This is not a signal. This is the establishment of reality within the Capital Sector. Here, speculation ends; architecture begins. Lower timeframes fall silent. The crowd remains in shadow. Only those who understand the language of price sectors and anticipatory structures can read what has already been written.
To this core is bound a minimum impulse of 7% — not an option, but a structural imperative. Price does not merely move: it must validate the integrity of the sector. Thus, the range of realization is not shaped by desire, but by inevitability.
International horizons have long been marked: not all may approach the source without being burned.
To outsiders — no entry. Not because it is forbidden, but because it is inaccessible . Reality here is constructed according to rules that are not debated — they are executed.
The point is not an invitation. The point is a test.
— The Architect

BTCUSD: Onchain data: Good Buy?A. Onchain current landscape:
- MVRV Ratio: Dropped from 1.83 to 1.64
- Well below the 2.0 "heated market" threshold
- Far from the 3.5 "overheated" danger zone
Interpretation: Market is NOT overextended; substantial upside room remains
- Net Unrealized Profit/Loss (NUPL): Declined from 0.45 to 0.39
Entered "Anxiety" zone, trending toward "Fear". Historically, NUPL below 0.40 marks excellent accumulation zones
Signal: Weak hands being shaken out, strong hands accumulating
B. Exchange Flow Dynamics: Smart Money is Accumulating
Critical Pattern Observed:
- Nov 11: -2,579 BTC (outflow - accumulation)
- Nov 12: -659 BTC (outflow - accumulation)
- Nov 13-14: +777 BTC, +5992 BTC (large inflows during panic selling)
- Nov 15-16: Mixed flows, continued selling pressure
- Nov 17: -4,036 BTC massive outflow
Analysis: The -4,036 BTC outflow on Nov 17, as price stabilized around $92k, is the first reversal signal. Smart money accumulated aggressively at depressed prices while retail capitulated.
C. SOPR Analysis: Capitulation in Progress
Spent Output Profit Ratio (SOPR) Timeline:
- Nov 11-12: Above 1.0 (healthy profit-taking)
- Nov 13-17: Below 1.0 (0.989-0.994)
Critical Insight: When SOPR falls below 1.0, it means investors are selling at a loss, a classic capitulation signal. This typically marks local bottoms and excellent entry points for patient buyers.
It means, we need to be patient and accumulate on key supporting levels.
D. Supply Dynamics: Weak Hands Exiting
Supply in Profit: Dropped from 73.6% to 64.5%
35.5% of BTC supply is now underwater (up from 26.4%)
This reset creates a stronger foundation for the next leg up
Investors who bought near the top are capitulating, clearing sell pressure
Whale Accumulation: Follow the Smart Money
BTC whales added ~30,000 BTC during the dip
Value: ~$3 bln in fresh whale accumulation
E. Technical levels:
- Strong supporting zone: 85000-88000.
- Confluence with descending channel's lower bound.
F. The Edge:
While headlines scream "crypto winter" and retail capitulates in fear, seasoned investors recognize this as a gift, a chance to accumulate a scarce, institutional-grade asset at a 26-30% discount from all-time highs, with clear onchain evidence of smart money accumulation.
Analysis by: Dat Tong, Senior Financial Markets Strategist at Exness

BTCBTC is forming a double bottom right at the 0.786 Fibonacci level, an area that tends to be very strongly respected. At the same time, the upper boundary of the current distribution range can act as a technical magnet. The influx of heavy volume and the strength patterns on the daily chart significantly increase the odds of a move up to $100,000.

Times are changing.Monthly change of color with well below zero selling volume. Haven't seen this in a while.

Bitcoin Analysis – Yesterday the Market Went Crazy Hey traders!
Let’s jump into today’s Bitcoin analysis.
Yesterday the market went full crazy mode
As I told you before, you could take both long and short positions from the extremes — and I did exactly that. Both directions activated ✔️
First things first, like always, the Fear & Greed Index:
24 — still in the Fear zone.
🔍 Quick Look at the Daily Timeframe
I want you to open your daily chart with ZERO indicators.
Just look at the structure.
The daily trend is still bearish, and right now we are simply in a correction of that bearish trend.
According to Dow Theory, if we consider the primary trend as down, then we’re currently in the secondary movement.
Keep that in mind — it matters.
🚀 Scenarios & Triggers
📈 Bullish Scenario (LONG)
If price wants to move up:
👉 Breaking 92,000 is my main LONG trigger.
I will definitely take a long there, especially if the move starts during the US session or if I see clean stepping volume.
You can also long from 91,500,
just wait for a clean 1-hour candle close.
📉 Bearish Scenario (SHORT)
For shorts on Bitcoin itself — honestly,
👉 there’s NOTHING until 89,200.
Market structure isn’t giving any short setup yet.
Until then:
🔸 either wait
🔸 or look for altcoins that are bearish against BTC — those can give great short setups.
🟢 About Yesterday’s Trades
Both trades activated:
Short → closed at 2R, solid.
Long → almost hit 2R, but because my entry was a bit far, price reversed and hit SL.
Totally normal when the market has no clear direction.
🎯 Final Notes
Keep the scenarios in mind.
Watch the volume.
And as always — risk management comes first.
Stay profitable 💚🔥

BTCUSDT BUY NOW!!!!!BTCUSDT Completed my last analysis predictions by meeting up 87k level with a sharp rejections on my recent previous post on btc am in on a buy right now to 94k then expecting to make a rejections off 100k level......

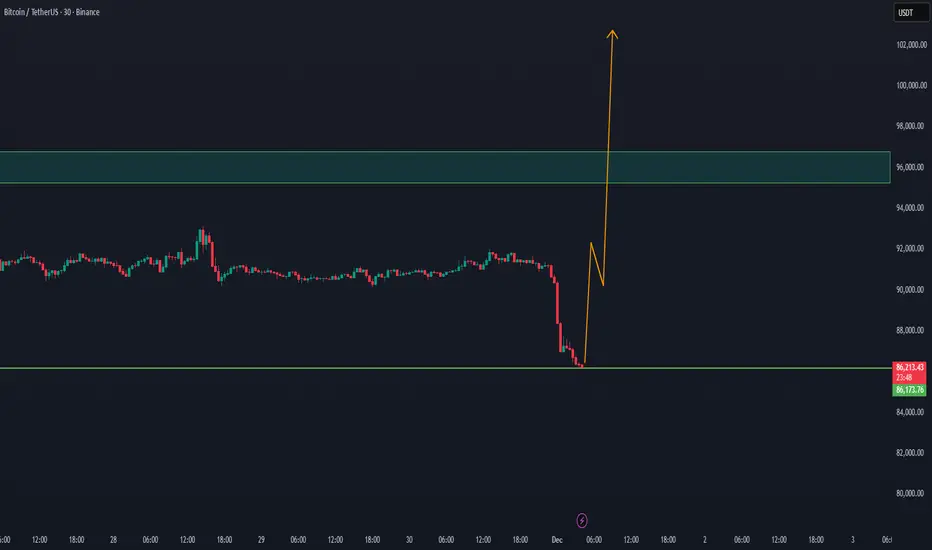
AFTER THE EXPECTED CORRECTION BTC ON WAY TO 100k+WE did expect with the last BTC update that a correction could happen at Bitcoin.
With the new study update, there is a good chance BTC will return step by step to the 100k level
Since the price action, new whale volume can enter BTC.
our previous update with the expectation of BTC fall
$BTC Top-Down Analysis (Short & Simple)Here’s a quick breakdown of what I’m seeing in $BTC.
Overall, all major timeframes are still bearish including the lower ones. CRYPTOCAP:BTC is currently holding weekly bullish OB zone along with a dynamic trendline support.
Weekly TF: We have one good sign and one bad sign.
Bad sign: Red trendline has already broken, and price is trading below it. (not ideal)
Good sign: There’s another trendline (light black) still acting as support, and confirmations on the weekly timeframe would strengthen this level.
Moving to Daily: Still very low momentum since Oct 10th crash no strong volatility.
On 4H: Structure looks slightly better, but any bullish shift would need a clean breakout above marked red resistance zone. 4H + Daily candle close above it would confirm a trend shift in internal (Daily) and external (4H) structure.
I kept chart simple so it’s easy to understand.
As for the big question: Is 80k the bottom?
Ans: Given that all timeframes are bearish and momentum is weak, calling it a confirmed bottom is premature. Only a strong pump from the current zone can support that idea. Most likely bottom should form somewhere around 80k - 75k.
This analysis is pure price action with multiple confluences (FIB, orderflow, ICT, SMC concepts).
If this analysis helped or you learned something new, please boost this post i appreciate the support!

OUTLOOK 1HR BTCUSD Analysis (6th Dec 2025)This is just a trade idea and not a financial advise
BUY/SELL SCENARIOS:
BUYS:
1) Body candle close above the 91445.2 level.
2) Retest the failed 1HR bearish OB at the 91445.2 level.
3) Create a 1/5M bullish engulfing candle to capitalise on BUYS towards the 95000 level.
SELLS:
1) Retest the 1HR bearish OB at the 90210.6 level.
2) Create a 3/5M bearish CHOCH with a body candle close.
3) Retest the bearish CHOCH level to capitalize on SELLS towards the 85000 level.
Happy trading guys
