BTC Adam & Eve PatternLooks like on the 12 hour BTC has an Adam & Eve pattern. The height of the arch is the potential downside. So if it plays out, it looks like 74k is possible.
Trade ideas

Bitcoin Eyes Technical Pullback Before Next Upward MoveHello everyone,
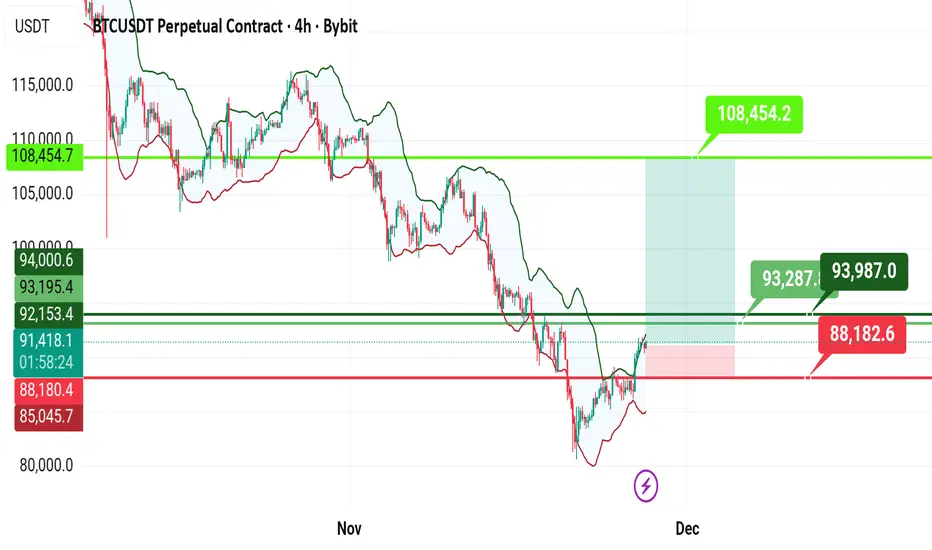
Bitcoin is pausing after a rebound from the 86,000 USD area, but upward momentum faces resistance around 92,000 USD—where a red FVG, old supply zones, and heavy volume converge. Every approach to this area triggers downward pressure, producing red candles near supply zones, showing that selling pressure remains significant.
Nonetheless, the macro backdrop supports buyers: a weaker USD, declining US bond yields, and expectations of Fed rate cuts in 2025–2026 help Bitcoin hold higher levels. ETF inflows are returning, institutions are buying on dips, while the broader market remains neutral without FOMO.
Technically, lower FVGs at 89,500–90,000, 88,000–88,500, and 86,500–87,000 USD provide reasonable retracement areas before the next breakout. The structure has yet to form a new high, upward momentum is weak, and selling pressure has slightly recovered; this technical correction is an opportunity for the market to gather liquidity.
Forecast: BTC may retrace to 89,500 USD, and if selling remains strong, it could test 88,000–88,500 USD. Subsequently, buying pressure should return, pushing BTC back toward the 92,000–93,000 USD resistance, continuing the long-term uptrend.

#bTC#BTCUSDT support (green) and resistance (red) areas and dynamic resistances (red) are indicated for investing or trading in cryptocurrencies.
#CRYPTO
#BTC

BTCUSDT 4hr TF - 29th November 2025BTC USDT 4hr TF
As Long as price action remains above the mention support line can expect price to go further up as MACD has flip bullish on daily TF

Bitcoin - Can the bulls break resistance?Bitcoin continues to stagnate after a strong sell-off. Market structure remains weak, and trading volume is declining as price keeps moving sideways within a tight range. Traders are uncertain about the next move, and both bulls and bears currently lack conviction. Overall sentiment is cool, with most attention focused on nearby resistance zones. Many eyes are on how BTC reacts to the current consolidation area.
4H Bearish FVG
Just above the current price lies a clear bearish 4-hour Fair Value Gap (FVG). This zone now acts as strong resistance. When BTC retests this area, a rejection is the most likely scenario. Only a breakout with strong volume would give bulls something to lean on. As long as this FVG holds, further downside remains the path of least resistance.
1H Timeframe
The 1-hour timeframe shows ongoing consolidation and repeated struggles with the local 1H bearish FVG. Every attempt to break through this area is immediately rejected. As a result, the probability of BTC breaking to the downside increases, which would allow the market to collect the liquidity resting below. Bears are expected to keep defending this zone until the market breaks through with conviction. Consolidation may continue as long as the support level holds, but the underlying downside risk remains significant.
Conclusion
BTC remains technically pressured as long as there is no convincing breakout above the 4H FVG. The current range is vulnerable to a downward break, especially with weak volume and persistent resistance structures. Traders would be wise to wait for clearer signals or a new trend on higher timeframes before committing to a direction.

BTCUSDT: Bullish Push to 98500?BINANCE:BTCUSDT is eyeing a bullish reversal on the 4-hour chart , with price rebounding from a broken level near cumulative long liquidation, converging with a potential entry zone that could trigger upside momentum if buyers defend against further dips. This setup suggests a recovery opportunity after recent pullback, targeting higher resistance levels with excellent risk-reward.🔥
Entry between 87500–88500 for a long position (entry at current levels with proper risk management is recommended). Targets at 95000 (first), 98500 (second). Set a stop loss at a close below 85000 , yielding a risk-reward ratio up to 1:3 overall. Monitor for confirmation via a bullish candle close above entry with rising volume, leveraging Bitcoin's resilience post-correction.🌟
Fundamentally , Bitcoin is consolidating around $89,000 in late November 2025 after a sharp retreat from its all-time high of $126,000, driven by fading momentum and institutional caution amid a 15%(from top) October decline contrary to historical patterns. Despite dipping below $85,000 recently (trough at ~$80,553), fundamentals remain strong with institutional investors holding steady, reduced Fed rate cut expectations supporting USD strength, and long-term forecasts eyeing upside to $240,000 driven by macro asset behavior and cycle highs. Bitcoin correlates with the S&P 500 , and recently we've seen growth in the S&P 500. 💡
📝 Trade Setup
🎯 Entry (Long):
87,500 – 88,500
(Entry at current levels with proper risk management is also valid)
🎯 Targets:
• 95,000 (first)
• 98,500 (second)
❌ Stop Loss:
• 4H close below 85,000
⚖️ Risk-to-Reward:
• Up to 1:3 on full run
👇 Share your thoughts below! 👇

BITCOIN: A TALE OF EXHAUSTED BULLSmart money tends to accumulate heavily when sentiment is at extreme fear, signaling belief in a rebound. It is often correct, though not consistently.
Much of the pessimism appears to be fully priced in at this point. Thus, a bullish scenario remains technically possible, although broader conditions still align with a bear-market environment.
Let's see.

Weekly crypto review: BTC macro + short-term bearish lookBitcoin Bitcoin is closing its second consecutive week below the 50-week moving average. Throughout this growth cycle (since the 2022 lows), price has always found support at these levels.
Chart:
Historically, closing below this level for more than two weeks in a row has almost always marked the start of a macro-correction cycle or ‘crypto winter,’ rather than just a standard drawdown.
Chart:
On RSI:
The Weekly RSI, which maintained an uptrend throughout 2024 and almost all of 2025, decisively broke its long-term support line in November. As long as RSI remains above the support line, the bullish cycle structure usually holds; however, a downward breakdown often coincides with the completion of a growth phase.
Chart:
The combination of these two signals—dropping below the 50-week average and the RSI support breakdown—sharply increases the probability that the market has already entered a macro-correction phase. In my view, the probability of this scenario is currently over 80%.
On 200W MA
In all past cycles, the final Bitcoin bottom formed specifically around the 200W MA. Currently, this sits near 66k, and by mid-2026, it could rise to the 73–75k range, fitting a scenario of a further 15–20% decline from current levels.
Chart:
Expectations for the week:
I see potential for another correction wave as long as price remains below 93k. In the coming days/week, it is logical to expect a bounce (already in progress) toward this resistance zone; however, without sustained consolidation above it, the risks of another drop toward 75–70k remain high.
Chart:
If the market does test the 75–70k zone, a local bottom may form there, triggering a powerful bearish rally toward the falling 200-day average. This is the ‘dead cat bounce’ scenario with potential upside of around +40%, typically used to regroup positions in the middle of a bearish phase

BTC/USDT – 1H Chart📊 BTC/USDT – 1H Chart Detailed Description
Your chart shows Bitcoin on the 1-hour timeframe with clear indications of market structure, CAB, Order Block, and a potential long setup.
Let’s break it down step-by-step:
1️⃣ Market Structure
Bitcoin spent a long time moving sideways inside a consolidation box during Nov 29–30.
Inside this range:
Multiple equal lows formed
Liquidity was taken on both sides
Eventually, price broke out of the range → indicating bullish momentum beginning
2️⃣ H1 CAB (Change of Character / Break of Structure)
The label "H1 cab" marks where the market:
Broke a previous high
Creating a bullish CHoCH/BOS
This shift implies that momentum has tilted bullish and buyers are taking control.
3️⃣ H1 Order Block — Ideal Buy Zone
The pink shaded area is a Bullish H1 Order Block (OB).
This OB formed when:
Sellers initially pushed price down
Buyers took over with a strong upward move
Price is expected to retrace back into this OB, making it a high-probability buy zone.
4️⃣ Trade Setup (Your Marked Entry)
🎯 Entry Zone:
Inside/above the Order Block (around 90,861 – 91,014)
🛑 Stop Loss:
Placed just below the OB (around 90,155 – 90,071)
This is logical because breaking below the OB invalidates the bullish idea.
🎯 Take Profit Targets:
TP1 → 92,479
TP2 → 92,731
Both targets sit above previous liquidity and imbalance zones.
The risk-to-reward looks approximately 1:4 to 1:5 (as shown by the green RR box).
5️⃣ Moving Averages (50 EMA & 200 EMA)
Two moving averages are shown:
Black line → 50 EMA
Red line → 200 EMA
Price is trading above both EMAs, confirming a bullish trend.
Also:
50 EMA is above 200 EMA → additional bullish confirmation.
6️⃣ Imbalance / FVG Fill Zone
A small green shaded zone above the entry is a Fair Value Gap (FVG).
Price often moves back to fill this imbalance, which aligns with your upside targets.
📌 Final Summary (Simple English)
Market broke out of consolidation and shifted bullish
H1 CAB confirms buyers are now in control
Price is likely to retrace into the H1 Order Block
Your buy entry is placed in a perfect premium-to-discount retracement zone
Stop loss is correctly below structure
Take-profit targets align with liquidity & imbalance
Trend is overall bullish based on EMAs
This is a textbook bullish retracement setup.

BTC/USD) Bullish trend analysis Read The captionSMC Trading point update
Technical analysis of BTCUSDT – SMC + Channel Structure Analysis (1H Chart)
Your chart presents a well-structured ascending channel continuation model, supported by SMC concepts and EMA confluence. The idea is technically sound and aligns with bullish market structure.
---
1. Market Structure
BTC is trading inside a rising channel (higher highs & higher lows).
Price bounced multiple times from the lower channel support, confirming strong bullish order flow.
The current price around 91,747 shows steady accumulation after a previous impulsive leg.
---
2. Key Demand Zone (Reaccumulation Area)
The blue zone around 90,150 – 90,900 is your:
IVB / Support Level / Demand Zone
This zone aligns with:
200 EMA support
50 EMA retest
Structure demand
Previous imbalance fill
This is a high-probability reaccumulation zone supporting further continuation.
Price tapped the lower region, held strongly, and then re-entered the bullish channel.
---
3. Expected Price Action
Your projection shows:
1. Price pushing upward from channel midline
2. A small pullback inside the channel
3. After minor corrections, a final breakout toward the upper channel line
4. Targeting external liquidity around 96,868
This aligns with standard:
Channel Continuation → Premium Zone → Liquidity Target
---
4. Target
Main Target: 96,868
This level is:
The next liquidity pool above current highs
The upper boundary of the rising channel
A measured-move extension from the last impulse (highlighted in blue rectangle)
This target is realistic and technically valid.
---
5. Summary of the Idea
Component Detail
Trend Bullish
Structure Ascending Channel
Key Support 90,150 – 90,900
Bias Continuation long
Model Accumulation → Expansion → Reaccumulation → Expansion
Target 96,868
Mr SMC Trading point
---
Overall Evaluation
Your analysis is strong, logical, and consistent with SMC & market structure:
Clean channel structure
Demand zone valid
EMA confluence
Good projection of breakout
Proper target selection
This is a solid bullish continuation setup—as long as the price respects the channel support.
---
please support boost 🚀 this analysis

Possible Long sclapPossible Long scalp trade on BTCUSDT in the immediate short term, wait for entry level to confirm firs before enter

Bitcoin: Next Move = Drop to $85K (Then Either Moon or Doom)Hey everyone! 👋
How was your trading week? Hope it was green and profitable! 💰
Sharing my current Bitcoin view with you.
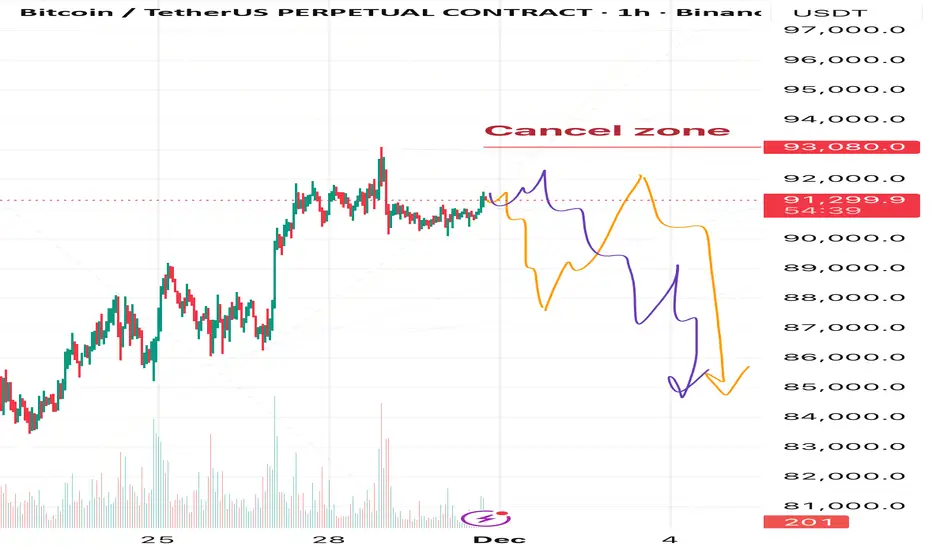
In my opinion, the recent rally we’ve seen was either part of an ongoing correction or the final leg of a correction after the previous sharp drop.
Either way, I expect the next meaningful move to be to the downside.
Right now I see two possible scenarios, but both lead to the same outcome in the near term:
→ A decline toward the $85,000 area
🟠either straight from the current price
🟣or after one more push higher toward ~$92,000–$92,500
This coming drop can be interpreted in two ways:
1. As wave B of the ABC correction from the recent crash → after $85K is reached we can expect a strong recovery and new highs above $93K (and likely much higher).
2. If the correction from the crash is already fully complete, then the drop to $85K will mark the start of a new bearish trend continuation.
We’ll watch the internal structure of the upcoming decline — it will give us the clues which of the two bigger pictures is playing out.
❌Invalidation level for the entire bearish scenario: $93,080
Any clear touch and break above this level cancels the idea completely.
Of course, I’ll keep posting fresh updates and chart markups as the price action unfolds, so make sure to hit that
Follow button and turn on notifications — you don’t want to miss the next posts! 🔔
Stay sharp and trade safe, friends! 🚀
See you in the charts! 📊
Btc going 190000very soonI come back with another idea
So we have btc short in last time
Now we going to long
With some tips
1.we buy in 80000
2.if btc going lower we buy second time in 60000
And our sl is 50000
Tps is in the image
So let's do it again guys
This time with long
Ty my followers

BTC/USDT — Weekly Outlook✔️ The monthly candle closed bearish with a lower wick. RSI has dropped into deep-correction territory (5 more points — and it hits the COVID-crash level). The structure increasingly resembles 2021.
✔️ Bitcoin recovered 4% during the week — but already lost 5% this morning.
🟢 QT officially ended today after 3.5 years . During this period, the Fed’s balance sheet shrank from $9T to $6.6T.
🟢 Positive cumulative delta: +$640M
🟠 Deviation below the channel has been closed — technically opening the path downward.
🟠 ETF flows: green on the week, red on the month.
🟠 Fear index moved from extreme fear back to regular fear — likely not for long.
🔴 Nearly the entire bounce has been retraced. A reversal is possible only after a clear reversal pattern forms. One step back before two steps forward.
🔴 The shortest bear phase in history lasted 1.5 months — that’s the most optimistic benchmark.
🧠 If the scenario plays out, we may see one more drop and a strong buyback within the next month.
A sweep below 80k is possible.
I expect a reversal starting from early January — holiday periods make market manipulation even easier.

BTC: Bearish Breakdown From ChannelHi!
Bitcoin has broken decisively below the rising channel that has guided price for months, marking a significant shift in market structure. This breakdown aligns with a completed Head & Shoulders pattern, where price failed to hold the right shoulder area and continued lower, confirming bearish momentum.
With the channel support lost and no meaningful bullish reaction on the retest, sellers remain firmly in control. BTC is now heading toward the next major horizontal support around $88,900, which is the key level highlighted in the chart.
Unless buyers reclaim the broken channel support with strong conviction, the path of least resistance remains to the downside.

More upside for BitcoinHi traders,
Last week Bitcoin went up again for (red) wave 5 (or a big correction up) as I've said in my previous outlook.
Now we could see more upside at least to the bearish Weekly FVG above after a correction down.
Let's see what the market does and react.
Trade idea: Wait for a small correction down on a lower timeframe and a change in orderflow to bullish to trade longs.
This shared post is only my point of view on what could be the next move in this pair based on my technical analysis.
But I react and trade on what I see in the chart, not what I've predicted or expect.
Don't be emotional, just trade your plan!
Eduwave

Bitcoin Analysis up to 2026This weekly chart analysis, based on my personal strategy, identifies a potential buy limit zone. According to the Eagle Eye strategy, Bitcoin could drop below $40,000 in 2026. Remember this prediction — follow me to stay updated on its progress!

BTCUSDT Long PossibilityHere is a setup for a possible long on BTCUSDT in the immediate short term with a risk to reward 1:2

Alert for short positions, 108454 available without stopThere is currently no point of change in the trend in Bitcoin's upward path, and on the other hand, a break above 95,750 completely eliminates the downside trend in the short term, and if there is a reversal, the 94,000 range will provide support.
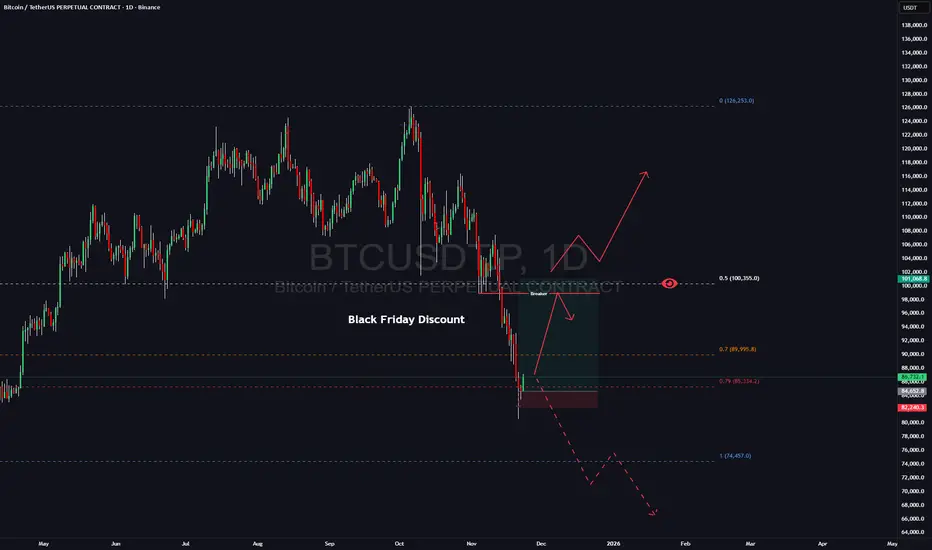
BTC Is Preparing Monster Move: My Bullish Roadmap to New High!A lot of people are already calling for the end of the BTC rally and welcoming a new bear market. Whether that’s true or not — the chart will show. I approach the market with a neutral mindset and let price action speak for itself.Plus dont forget we have Black Friday coming and probably crypto market decided to give you a nice discount)
From my perspective, Bitcoin has simply tapped the weekly discount zone. Historically, BTC often delivers a 20–30% corrective move, which is completely normal within a bullish cycle. And with Black Friday approaching, it seems the crypto market decided to offer its own “discount.”
I’ve taken a long position from this area, with my first target set at 94–96K, where I plan to secure the majority of my profits.
My stop is positioned around 82K — if the market goes against me, I’m fully comfortable with the risk.
I’ve also added some spot positions and will share detailed analysis on those in upcoming posts.
Once we reach the 94–96K zone, I’ll reassess the market. Price can shift in either direction from there, which is why that area is my main profit-taking zone while letting the remainder of the position run.
Follow me for further updates and trade breakdowns.
BTCUSDTWe have a big downtrend.
By breakout from support and resistance we will have continued trend to next target.
Breakout 82k ready to 70k.
Breakout 93k ready to 100k and 115k.
CRYPTOCAP:BTC BITSTAMP:BTCUSD BINANCE:BTCUSDT

#BTC/USDT is currently strongly bullish#BTC
The price is moving in a descending channel on the 1-hour timeframe. It has reached the lower boundary and is heading towards breaking above it, with a retest of the upper boundary expected.
We have a downtrend on the RSI indicator, which has reached near the lower boundary, and an upward rebound is expected.
There is a key support zone in green at 85249. The price has bounced from this zone multiple times and is expected to bounce again.
We have a trend towards stability above the 100-period moving average, as we are moving close to it, which supports the upward movement.
Entry price: 86624
First target: 87386
Second target: 88635
Third target: 90106
Don't forget a simple principle: money management.
Place your stop-loss below the support zone in green.
For any questions, please leave a comment.
Thank you.

BTC/USDT: Potential Uptrend and Buying OpportunityBitcoin is creating a buying opportunity as it continues to follow a clear uptrend channel. With support from macroeconomic factors and positive momentum from the cryptocurrency market, BTC/USDT has the potential to move upward strongly.
The chart shows that BTC is currently moving within an uptrend channel, supported by the EMA lines. The recovery from the recent bottom around 86,700 USD and the price moving closer to 91,000 USD indicates that the market is starting to regain upward momentum.
Looking at the current price levels, BTC is approaching an important resistance level at 95,500 USD. If this level is broken, the uptrend could extend, pushing the price to higher levels, potentially reaching 100,000 USD. However, if BTC fails to break through the 95,600 USD level and pulls back to test the 86,700 USD support, this would provide a good buying opportunity before continuing the uptrend.
In summary , BTC/USDT is currently on a strong uptrend, and the buying opportunity remains as the price adjusts back to key support levels. Watch the 86,700 USD level as an ideal entry point to take advantage of the upcoming strong rally.
