BTCUSDTWe have a big downtrend.
By breakout from support and resistance we will have continued trend to next target.
Breakout 82k ready to 70k.
Breakout 93k ready to 100k and 115k.
CRYPTOCAP:BTC BITSTAMP:BTCUSD BINANCE:BTCUSDT
Trade ideas

#BTC/USDT is currently strongly bullish#BTC
The price is moving in a descending channel on the 1-hour timeframe. It has reached the lower boundary and is heading towards breaking above it, with a retest of the upper boundary expected.
We have a downtrend on the RSI indicator, which has reached near the lower boundary, and an upward rebound is expected.
There is a key support zone in green at 85249. The price has bounced from this zone multiple times and is expected to bounce again.
We have a trend towards stability above the 100-period moving average, as we are moving close to it, which supports the upward movement.
Entry price: 86624
First target: 87386
Second target: 88635
Third target: 90106
Don't forget a simple principle: money management.
Place your stop-loss below the support zone in green.
For any questions, please leave a comment.
Thank you.

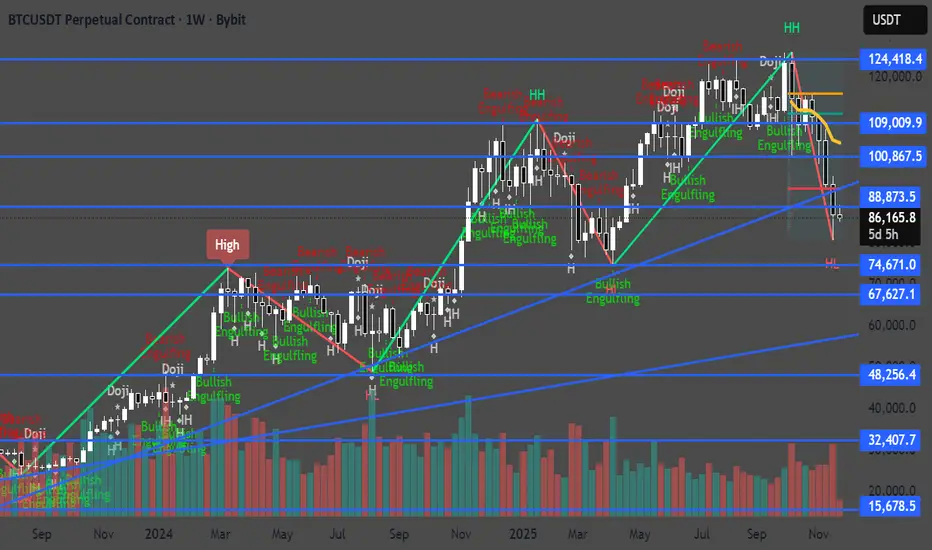
Bitcoin trend analysis!(BTCUSDT) The weekly structure remains bullish overall, but is currently in a corrective leg back into a key higher-timeframe demand zone.
Confluence of the long‑term ascending trendline and horizontal zone around 80,000–82,000, just under the current price; a deeper buffer of 76,000 marks the top of the “significant and major support” area highlighted on your chart.
The previous distribution band at 123,000–125,000 remains the main upside target and weekly resistance; any new impulse leg will likely aim back into this zone first.
The rounded basing structures since 2022, plus the current pullback, suggest a large continuation pattern rather than a full trend reversal, as long as weekly candles keep closing above the 76k support shelf.
80k–76k holds and forms a clear higher low; the weekly chart favors a renewed push toward six-figure territory and a potential retest of the 123k–125k highs. A decisive weekly close below 76k would invalidate this and open risk toward the mid-60k demand block inside the grey zone.

BTC/USDT: Potential Uptrend and Buying OpportunityBitcoin is creating a buying opportunity as it continues to follow a clear uptrend channel. With support from macroeconomic factors and positive momentum from the cryptocurrency market, BTC/USDT has the potential to move upward strongly.
The chart shows that BTC is currently moving within an uptrend channel, supported by the EMA lines. The recovery from the recent bottom around 86,700 USD and the price moving closer to 91,000 USD indicates that the market is starting to regain upward momentum.
Looking at the current price levels, BTC is approaching an important resistance level at 95,500 USD. If this level is broken, the uptrend could extend, pushing the price to higher levels, potentially reaching 100,000 USD. However, if BTC fails to break through the 95,600 USD level and pulls back to test the 86,700 USD support, this would provide a good buying opportunity before continuing the uptrend.
In summary , BTC/USDT is currently on a strong uptrend, and the buying opportunity remains as the price adjusts back to key support levels. Watch the 86,700 USD level as an ideal entry point to take advantage of the upcoming strong rally.

BTC - Ranges overview (update) Let's have a look at the current PA on BTC.
The weekly order block (yellow box) is reacting properly so let's see what we should expect from here.
IF we fail to hold the weekly order box in the course of the coming weeks expect lower prices towards 85K.
IF we regain the yearly open (red line) and hold , the lows will be in. We can then expect BTC to retrace back towards 100K and higher.
As always no need to guess where the market wants to go...PLAN...BE PATIENT...and WAIT FOR THE MARKET TO SHOW YOU ITS HAND.
Stay safe and never risk more than 1-5% of your capital per trade. The following analysis is merely a price action analysis and does not constitute financial advice in any form.

DeGRAM | BTCUSD will rebound to $92k level📊 Technical Analysis
● BTC/USD formed a false break below the 82K support zone while bouncing off the long-term dynamic support line, signalling seller exhaustion and a potential mid-trend reversal.
● Price is reclaiming structure inside the descending channel; a push toward 90–92K becomes likely if buyers break the local diagonal resistance.
💡 Fundamental Analysis
● Bitcoin sentiment improves as risk appetite stabilizes and institutional inflows show signs of recovery.
✨ Summary
Support: 82K. Targets: 90K → 92K. Medium-term bullish bias while above dynamic support.
-------------------
Share your opinion in the comments and support the idea with a like. Thanks for your support!

BTCUSD NEXT SELL OFF ZONE!!BTCUSD completed +5,000pips from my last post order sell-stop order today price is expected to made a minor pull back at my poc area at 87k and confirmations from my min time frame to sell down to 80k......

BITCOIN MAPPING FOR BEAR MARKETIn this video I will try to map the potential for Bitcoin if we consider the current condition is bear market

BTC: The Bitcoin bounce is not a trend reversal🚫 The Bitcoin bounce is not a trend reversal
Here’s why the current move looks more like a liquidity trap than a real bullish reversal:
- Momentum is lagging — the rebound isn’t supported by strength.
- Liquidity spikes look engineered to squeeze short positions rather than coming from genuine buyers.
- ETFs are selling while BTC is pumping → classic exit liquidity behaviour.
- We remain in a bearish trend, and the current flag pattern is on the verge of breaking. Statistically, these patterns break down, with targets equal to the size of the previous leg.
- Price is rising while volume is falling → this is a hidden bearish divergence on volume.
🎯 What I’m seeing
It looks like many institutions were caught off guard by the depth of this downtrend, and now they’re trying to reduce exposure.
They appear to be engineering a bounce to attract retail FOMO, allowing them to exit with smaller losses — a classic liquidity extraction move.
As I’ve mentioned several times already:
👉 The primary trend remains bearish until Q2 2026, though we should expect bounces and manipulative moves along the way.
⚠️ My advice
Don’t deploy all your capital into a fake FOMO rally and become the institutions’ exit liquidity.
Wait for a proper bottom confirmation, such as:
A W pattern, followed by a successful retest with a higher low.
❌ Invalidation
This analysis becomes invalid only if the current pattern breaks upward with strong volume.
DYOR
Still no reversal sign on weekly timeframeI expect a sweep of 74k before we see a reversal sign from btc.
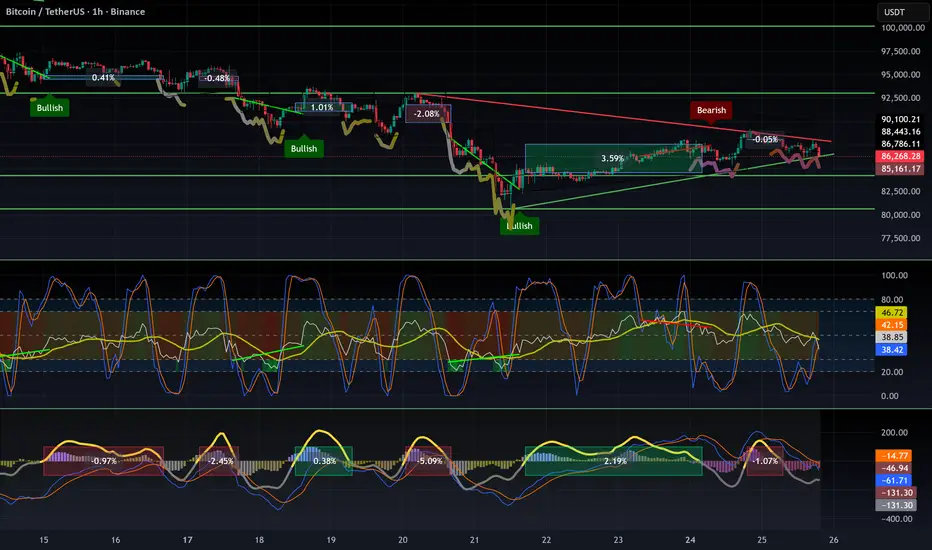
BTCUSDT – Bearish Flag Breakdown + 1H Bearish Divergence
Bitcoin just broke down from a clear bearish flag structure after forming 1H bearish divergence right at the flag’s upper boundary. This is a classic continuation setup after the strong impulsive drop that came before it.
The flag acted as nothing more than a relief channel — price kept grinding upward with weakening momentum while RSI printed lower highs. That’s the textbook recipe for a bearish divergence and a high-probability breakdown.
Now that price has snapped below the flag support, the structure favors a continuation of the previous bearish leg.
🔥 Key Points
Strong impulsive drop → consolidation inside rising flag
1H bearish divergence signaling exhaustion
Clean breakdown confirms bearish continuation
Momentum finally aligned with structure — sellers taking control again
Downside levels marked on your chart line up well with previous liquidity pools
📉 Outlook
Bias remains bearish unless BTC reclaims the flag structure. A continuation into the lower target zone (highlighted in green on your chart) is the most probable path. If price retraces back into the broken flag for a retest, it would be a fresh continuation entry zone.
This breakdown is clean, logical, and follows classic price-action behavior — nothing confusing here.

BTC vs QQQWhy the BTC dump? Nasdaq future gapped down, then BTC dumped with high volume 30 minutes later.
Now the day BTC is highly correlated with tech stocks, especially on the down side.

BTCUSDT (bitcoin) toward $91k?Hi!
BTC has finally broken its major descending trendline, signaling a shift in market sentiment after a long period of selling pressure. Following that break, price formed a clear inverse head and shoulders pattern, showing that buyers stepped in aggressively after the final liquidity sweep at the Head. Since then, BTC has been moving inside a well-defined ascending channel, consistently printing higher highs and higher lows, which confirms bullish momentum.
As long as price respects the lower boundary of this channel, the upside structure remains intact. The next significant resistance sits at 92,500–93,000, which also aligns with the previous breakdown zone you highlighted. This area is likely to attract sellers, making it a logical target for the current move.
Overall, the chart supports continued upside toward 93K, unless price breaks below channel support, which would weaken the bullish reversal setup.

Bitcoin (BTC) Update| Trading Range Low Target Bitcoin has rejected from the local channel high, where the VWAP and the 0.618 Fibonacci retracement created strong confluence. The rejection was confirmed by a clear engulfing candle, sending price back toward the base of the previous consolidation zone.
A series of candle closes around this area may occur before a decisive move forms. For now, BTC remains structurally contained within its broader trading channel, signalling slow and corrective behaviour unless a breakout develops.
Key Points
- Rejection at channel high with VWAP + 0.618 Fib confluence
- Engulfing candle signals weakening momentum
- Price revisits prior consolidation base
What to Expect
If BTC holds this consolidation base, a short-term bounce is possible. A breakdown, however, would reopen lower support retests within the trading channel.
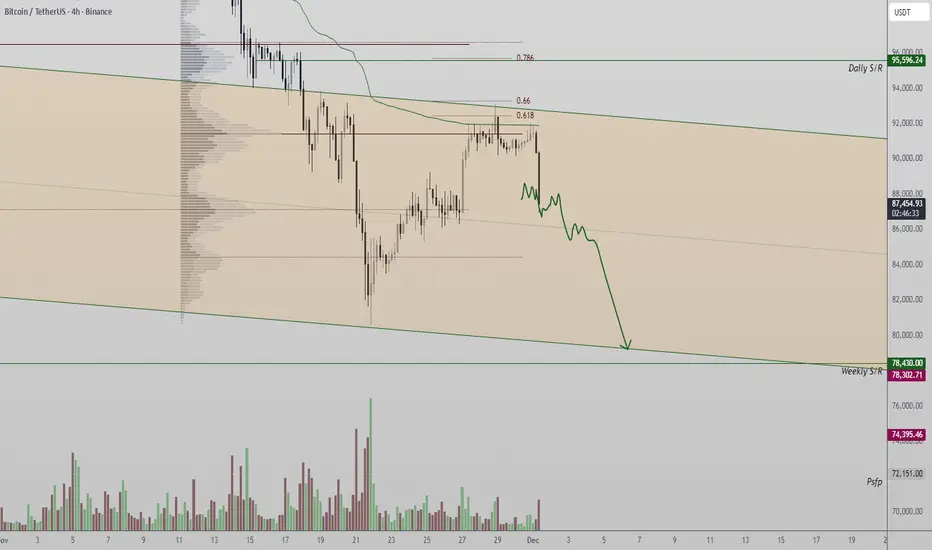
Chart Analysis: BTC / USDT (Weekly Timeframe)Pattern: EMA Retest (Potential Breakdown Risk)
The chart shows Bitcoin (BTC) facing notable bearish pressure after recent highs. Price is currently testing the 50-week EMA, a historically important support zone that has previously triggered strong bullish rebounds. However, current momentum shows weakness as sellers dominate.
Key Observations
🔹 Support Zone: Around $100,900 (50 EMA) — acting as critical dynamic support.
🔹 June Low Support: Near $98,200, the next major level to monitor.
🔹 Bearish Candle: BTC down nearly 8% for the week, showing strong selling pressure.
🔹 Bull Bear Power (BBP) Indicator: signaling that bearish strength outweighs bullish demand, and selling momentum remains strong.
🔹 Previous Bounces: The last two retests of the 50-week EMA (circled) led to solid recoveries, but this time, price action looks weaker and sentiment more cautious.
Potential Move
If BTC fails to hold above the 50-week EMA, further downside targets could be:
🎯 Target 1: $95,000
🎯 Target 2: $90,000
Conversely, a strong bullish reaction from the 50 EMA may spark a rebound phase and signal renewed accumulation.
Summary:
Bitcoin is currently at a critical support retest on the 50-week EMA. The Bear Power indicator suggests growing downside pressure, and a weekly close below $100K could confirm a deeper correction. Holding this zone, however, might preserve the broader uptrend.
#Bitcoin #BTC #BTCUSDT #CryptoAnalysis #TechnicalAnalysis #TradingView #CryptoTraders #CryptoMarket #BullBearPower

Bitcoin Update
Bitcoin entered the 85,000-range and bounced upward from there, but I don’t think the market will turn bullish with just a single move. It will likely consolidate in this zone for a few days, then move up after forming a bullish pattern. Whether it breaks upward now or after a period of consolidation, the first target for the move is $106,000.

BTCUSDT short term trade on 1h timeframeThere is an ascending wedge, a divergence has formed on the hourly timeframe, and the chart is overbought at 4h. This is a standard set of arguments that usually points to a weakening of growth, especially after a sharp correction. The optimal zone for correction, in my opinion, is within the marked block (85-86k)

Bitcoin Nov Analysis | Blood Month !Let’s dive into the monthly outlook for Bitcoin and see what the market is really telling us.
The month we just went through was — without exaggeration — one of the most important months of 2025, if not the most important.
Why?
Because the market finally revealed its direction and gave us clarity.
I’ve included the previous halving date, the start of the bull run, and the breakout of Bitcoin’s all-time high in the chart. As you can see, in past cycles:
After the halving, the monthly trend turned bullish almost immediately
After breaking the key $10K level, Bitcoin didn’t print a single red monthly candle until it reached $60K
And the first weak monthly candle at $60K triggered a massive correction
But this cycle is different.
This time, after the halving, the market remained flat and lifeless.
And after breaking the previous ATH at $69K, we only moved 63% — compared to the insane 523% rally in the last cycle after breaking the ATH.
Not even close.
And after just one strong bullish candle above $69K, monthly candles started weakening again.
So what does all this tell us?
➡️ This cycle is NOT behaving like previous ones — neither in time nor in price structure.
In the previous cycle, we would already be near the “correction phase” by now.
But…
Does this mean Bitcoin is turning bearish?
Simple answer: No.
Not yet.
We are still making higher highs and higher lows on the monthly chart.
So the macro trend is not bearish.
🔻 When does Bitcoin actually turn bearish?
Two clear signals:
If the first weekly candle closes below the key $82K level, the macro structure breaks
If buyers attempt another rally and fail, forming a lower high and lower low, that confirms a trend reversal
Until then, macro bearishness is not confirmed.
🔼 When do we return to bull-run mode or altseason?
It’s too early to make that call — but one key level matters:
👉 A weekly close back above $100K
If that happens, it becomes a strong bullish signal, and then depending on Bitcoin dominance, we decide whether to rotate into BTC or into altcoins.
😨 Fear & Greed Index
It’s still sitting at 20, meaning the market remains in fear.
🔑 Final Thoughts
Respect your risk management
Watch the key levels
Avoid overexposing yourself to high-risk markets like crypto
Enter the market only with full awareness and proper planning
Drop your thoughts in the comments — I’d love to hear your view! 🚀

Jp morgan target 170kI think we go to 106k shortly, then BTC will appear to make a bearish head and shoulders. Once everybody sees that and turns bearish, it goes to 170k. A lot of sideways.

The god of fractal draw thisORVIBE STRATEGY
A new model thinking
New analyses and …
ORVIBE.
BE THE LIGHT!

Bitcoin trade analysis1. Trend & Structure
Price is inside a rising channel (light-blue lines).
BTC is sitting directly on the lower channel support, meaning this is a key decision zone.
Small candles and narrowing price range indicate compression before a breakout.
2. Support & Resistance
Level Type
90,300–90,500 Local support (EMA cluster + channel bottom)
91,200 Minor resistance
93,000–93,400 Major resistance (top of channel + horizontal level)
95,000 Higher-timeframe resistance
BTC is trading directly above major support, which makes a long more favourable unless support breaks.
3. Candlestick Interpretation (single clear conclusion)
Current candles show small-bodied consolidation with long lower wicks → buyers are defending support, signalling a bullish continuation attempt.
→ Precise conclusion: Bulls are holding support, making a bounce more likely than a breakdown.
4. Indicator & Oscillator Signals
EMA Ribbon (12–200): Price is sitting on the fast EMAs but still below high-TF EMAs → slightly bullish short-term but still inside a broader bearish pressure zone.
Volume: Decreasing → momentum is coiling → breakout imminent.
5. Elliott/Wave Structure
Price appears in a corrective wave (wave 4) inside an ascending channel.
If support holds, a push toward wave 5 to the channel top (92.5–93.4k) is likely.
6. Volume Analysis
Buyers appear on each dip.
Selling volume is weak.
No capitulation spike → accumulation-type structure.
🎯 Conclusion
BTC is at the best possible long-entry zone inside the rising channel.
A long is preferred as long as 90,300 support holds.
A short becomes valid only if price closes below the ascending channel.

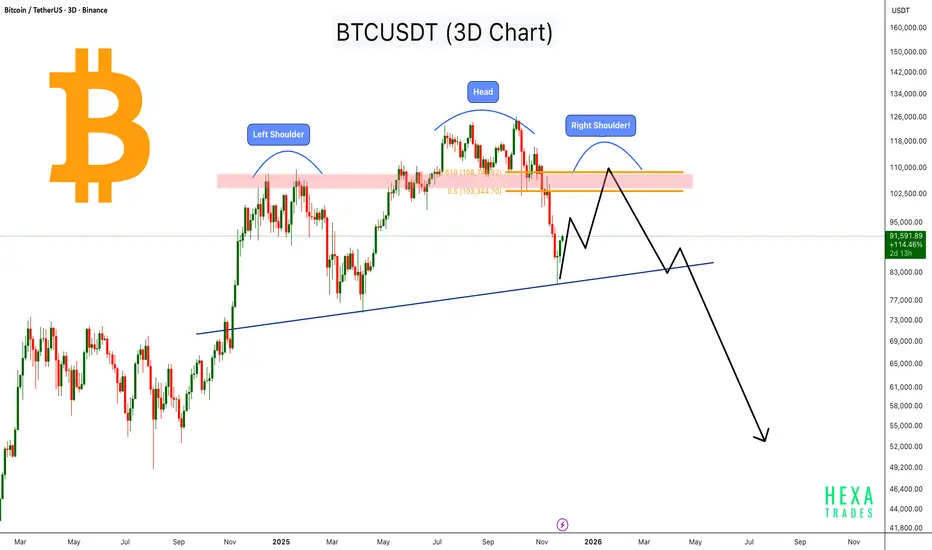
BTC Forming a Massive Head & Shoulders - Macro Reversal Ahead?Bitcoin is forming a large Head & Shoulders pattern on the 3-day chart, with the left shoulder and head already completed, and the right shoulder now developing within the major resistance zone around the 0.5–0.618 retracement (103,000–108,000).
Price recently bounced from the long-term ascending trendline, but the overall structure still suggests a potential macro reversal unless Bitcoin breaks above the resistance zone with strong momentum.
If the right shoulder completes and price rejects from the supply zone, BTC could retest the trendline again. A breakdown of this trendline may open the door for a deeper correction toward the lower demand zones.
This is a medium-term pattern and may take 1–3 months to validate fully.
Key Points:
- Left Shoulder, Head, and Right Shoulder zone highlighted
- Major resistance at $103,000–$108,000
- Price bouncing from long-term ascending trendline
- Breakdown below the trendline may trigger a strong downside move
- Right shoulder formation may take a few more weeks
Cheers
Hexa
BTC: Waiting for 120KBTC is currently below 90K, which is a great buying opportunity. Hold patiently and wait for it to reach 120K.
I'll send out accurate signals right at the opening every day, don't miss out.
