Watch Out! $BTC Trap Ahead!CRYPTOCAP:BTC 1H & 30 mint trend is still bullish, but on lower TF it has shifted to bearish. Be careful don’t get trapped by a small weekend pump.
Wait for my next update
Trade ideas

Bitcoin: The Downtrend Begins Just as the title suggests, this is where Bitcoin is poised to fall once more.

My thoughts on BTC and the Market. $200K BTC looms on 2026.My thoughts on Bitcoin for 2025 yearly close and 2026. Covering TA, Macro, bullish signals, bearish signals and more.
Do you agree or disagree?

BTC not over yet.BTC is not over yet, As you can see on the chart there are still 2 major trends remaining as BTC is having a reaction of the 85k level. As long as we can remain this area, there are still possibilities fo a push to a new ath.

BTCUSDT.P - November 28, 2025Bitcoin is in a short‑term uptrend, riding a rising trendline after breaking out from prior consolidation and now pressing into a well‑defined resistance band around 92,100–92,600.
The chart outlines a tactical long setup with support around 90,100–90,200 as the key pivot; holding above this zone favors continuation toward the higher resistance/target region near 94,500–95,000, while a clean break back below the trendline would invalidate the bullish structure and open room for a deeper pullback.


BTC mid-term TABitcoin is having a relief rally from the continuous falling initiated by excessive selling, you may also see the MACD crossover, yes, but it's in bearish area and it's too early for the downtrend reversal, it's just a bounce or a short-lived rally, you may call it the way you like it, but the bearish downtrend is engaged and it's still very strong and it will need much more time and effort to finally bottom out. For now let's hope for X-mas rally to continue.
Watch for the resistance levels at 95k and the falling SMA50.

BTC 4H – Fib Rejection, But Is Another Leg Down Next?BTC is pressing into a heavy confluence area: the macro downtrend line, the 50/100 EMAs, and the 0.5–0.786 Fib retracement zone. Price reacted cleanly from local supply and failed to close above the cluster of moving averages, keeping the 4H structure bearish.
The Stoch RSI is fully overbought and curling down, signaling weakening bullish momentum on approach into resistance. Unless BTC can reclaim the trendline with a strong impulsive close, this area favors a lower-high formation and continuation toward downside targets.
A confirmed rejection here opens a move back toward prior demand zones, while a break above the 0.618 would shift momentum toward deeper Fib targets and potentially challenge the trendline from above.
Key levels:
• Resistance: 93,826 / 97,010 / 101,543
• Support: Prior local demand under 90K
• Structure shift only if trendline breaks with volume

Bitcoin is approaching an important support level (1D)Bitcoin has entered a strong bearish structure.
It is currently near an important origin zone that has broken significant highs (BOS). It is expected to make an upward reversal from this area.
It’s natural for this momentum to require some base-building, and since the movement is on the daily timeframe, the upward reversal may take some time.
The target range is 95K to 96K.
A daily candle closing below the invalidation level will invalidate this analysis
Do not enter the position without capital management and stop setting
Comment if you have any questions
thank you

BTC: buyers have brought the price back into the range.This analysis is based on the Initiative Analysis (IA) method.
Hello traders and investors!
On the 4-hour timeframe, the buyer has brought the price back into the range and absorbed the seller’s attack bar at the lower boundary.
A buyer initiative is developing on the 4H chart, with a target at 93,160.
It’s possible that buyers will manage to break the upper boundary of the range, which is currently at 93,836.
On the daily timeframe, the price touched the 89,256 level, and a new range is starting to form. Within this range, the nearest seller target is 89,253.
Key levels for potential long setups are buyer defenses at 89,253 and 86,116.
Sellers can look for short setups if the upper boundary of the range is defended by the seller on the 4-hour timeframe, with a target at 89,256.
Wishing you profitable trades!

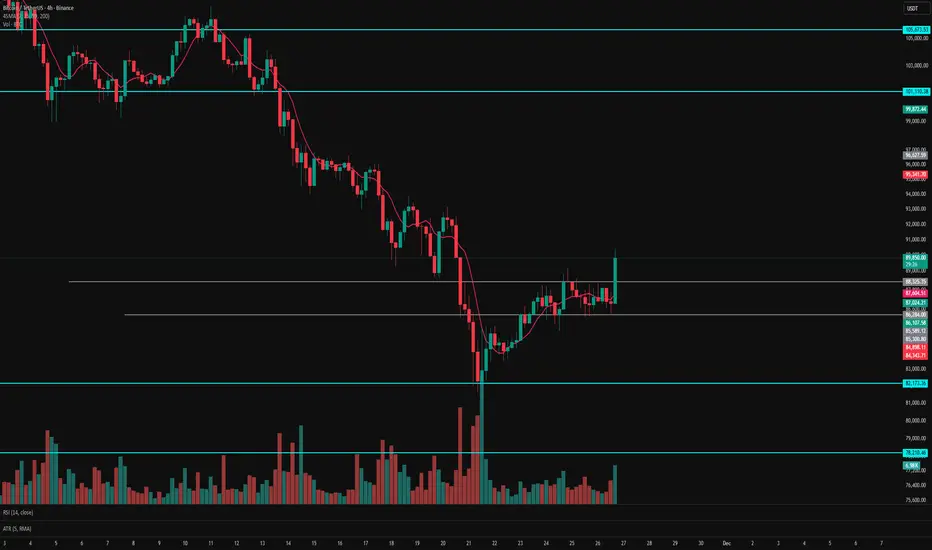
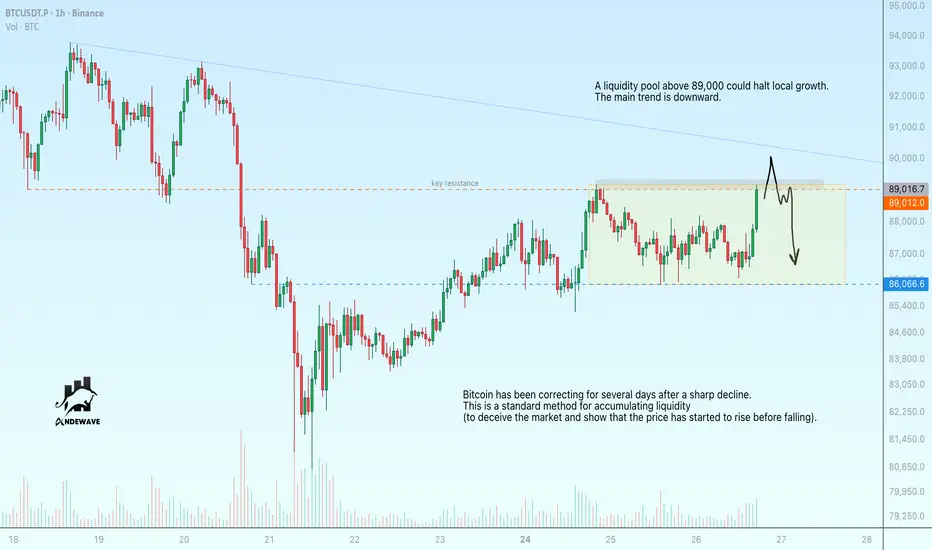
Bitcoin is testing 89,000. False breakout?Bitcoin is testing 89,000
A liquidity pool above 89,000 could halt local growth. The main trend is downward.
Bitcoin is undergoing a correction over several days after a sharp decline.
This is a standard tactic for accumulating liquidity (to deceive the market and show that the price has started to rise before falling).
A false breakout could reverse the local movement from upward to downward and send the price to 86K-83.5K
BTC, ETH, XRP market snapshotBTC — key levels: $82,000 and $98,000.
If we break above $98K, a new all-time high becomes likely. If we move below $82K, there’s a high probability of revisiting the $60K area and entering a crypto winter. For now the market looks uncertain today, so I want to see how things develop. The monthly close is crucial.
ETH — possible local H&S pattern, target around $3,500 (which also aligns with the daily MA50/200 — a trend-change signal). It’s important to hold $2,960 to continue the move.
Strong resistance is at $3,800. Support sits in the $2,500–2,700 zone, which has already been tested — if we revisit it again, the next level opens up around the $2,000 area.
There’s a divergence forming on the 4h timeframe, so a local trend break is possible. For now I’m watching my long positions, with the stop moved to breakeven around $2,800.
XRP still hasn’t played out the divergence on the monthly timeframe. There’s a strong risk of forming a double top if we close below $2, although market makers are still fighting here and we can see a long signal on the daily.
But I still have the feeling we may see another low — and not only on XRP.

Btc analysis After a long time away from the market, I am back to share a new idea with you,
Today, as in the past, there is a lot of fear for new buyers, but that is normal
Bitcoin can go back to 100k or beyond
I will update again in the coming days.

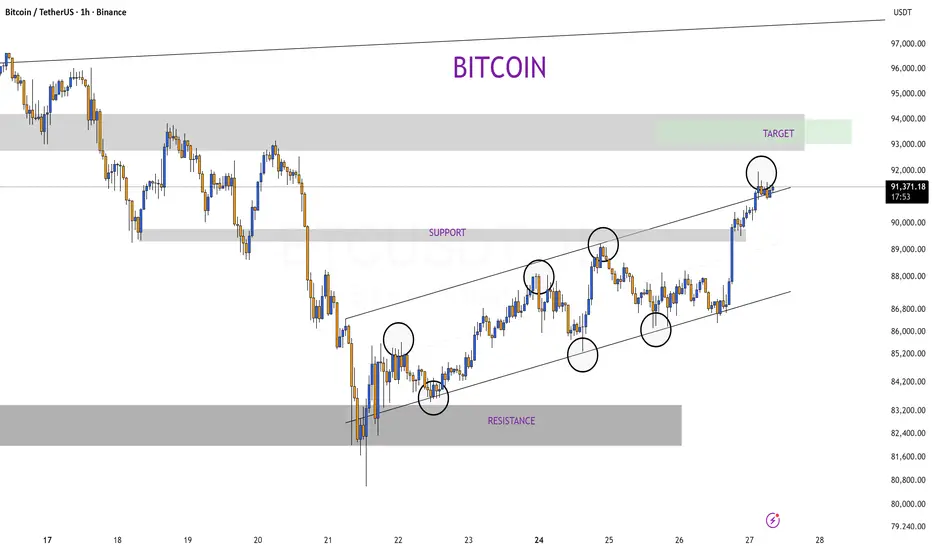
Bitcoin Analysis – Channel Break & Next Move ScenariosBitcoin has been respecting its ascending channel all week. Yesterday, price tapped the lower boundary of the channel and immediately launched upward, breaking through the key 90,000 resistance with strong momentum. It now sits at the upper boundary of the channel, a zone where the market often pauses to decide the next move.
From here, we have two clear scenarios:
🔵 Bullish Scenario
Bitcoin gains new volatility at the top of the channel.
Strong bullish momentum pushes price toward the 94,000 target.
A clean breakout above the channel would confirm continuation.
🔴 Bearish Scenario
Bitcoin rejects the channel high and returns to 90,000 to collect liquidity.
If liquidity is swept and buyers re-enter, price resumes the overall upward trend.
BINANCE:BTCUSDT BITSTAMP:BTCUSD
BITCOIN - D11. Market Context
BTC has completed a 5-wave bearish sequence (labeled (1) → (5)) with wave (5) ending inside a major demand zone around 85,000 – 88,000.
Price is now showing a strong bullish rebound from the zone.
This area aligns with:
Historical demand
High-volume node
Previous structural support
A break-of-structure wick rejection
2. Key Levels
Support Zones
85,000 – 88,000 (major demand, wave (5) low)
91,000 – 92,000 (short-term support after bounce)
Resistance Zones
101,000 – 102,000 → 0.5 Fib retracement
107,000 – 108,000 → 0.618 Fib retracement + previous supply
Both are important targets for the upcoming correction.
3. Expected Price Structure (Bullish Correction Scenario)
The projected path on your chart suggests a corrective upward structure, likely an A–B–C or 3-wave move.
Phase 1 – Current Move
BTC is now in a strong impulsive leg upward from the demand zone.
Phase 2 – Pullback
Around 100,000 – 102,000, price may stall and form a pullback (wave B).
Phase 3 – Final Push Up
A continuation toward 107,000 – 108,000 is probable, where a larger decision zone forms.
This aligns with:
0.618 retracement
Past supply
Completion of corrective structure
4. Overall Bias
Short-term: Bullish correction
Medium-term: Neutral → waiting confirmation whether correction ends or trend reverses
Long-term: BTC still above macro trendline, and holding demand strongly → bullish macro outlook remains intact unless 85K breaks.
5. What to Monitor
Reaction at 101K (first resistance)
Momentum into 107K (key corrective target)
Whether price forms:
Higher low → trend reversal
Or rejection → continuation of macro downtrend

BTCUSDT Potential Bearish PullbackHi,
BTCUSDT at the 1-hour timeframe. Price looks bearish, responding to the 88908.09 level. We want to see the break of 86417.09 for a potential drop toward 77813.35.
And we have four potential Fib price target levels.
Happy Trading,
K.
Not trading advice

Bitcoin Ready to Casually Liquidate $300MLadies and gentlemen, today is November 26. If you’re still alive in the market, let me be the first to congratulate you—because that means you actually use proper capital management and set stop losses.
In this analysis, we’re going to pinpoint Bitcoin’s next triggers together, get a crystal-clear picture of the current structure, conditions, and scenarios, and trade them side by side.
Hey, I’m Skeptic , and this is Skeptic Lab . If you want to level up your trading knowledge through data, psychology, and real strategy and actually become consistently profitable, you’ve come to the right place.
Let’s jump straight to the charts. 📉
In the daily timeframe , after that massive sell-off candle on November 21, Bitcoin immediately went into ranging mode. Volume dropped hard, and RSI bounced back above 30. After breaking 100k—as I’ve been saying for weeks—the MWC has officially turned bearish, so every bounce back to that zone is nothing more than a pullback. If this 4H correction we’ve started continues, it can easily reach 91,213.99 (the 0.5 Fib), so if you’re opening longs, your target should be exactly 91,213.99.
🔍Now let’s drop to the 4H timeframe to hunt for actual triggers.
In the 4H, we have a weak upward channel that’s really just the daily bearish correction. We’re ranging between two key levels:
- Resistance: 88,118.70
- Support: 86,224.62
Breaking either one is our long or short trigger.
But here’s the risk-management difference: 📍
For longs (which are counter-trend to the MWC), we use a very tight stop loss and take profit quickly.
For shorts, we can accept slightly higher risk and scale out with partial profits.
Important note: Throughout this entire range box, volume has been consistently dropping—this means the next move is getting closer and closer. Stay very alert inside this box.
If this analysis helped you, I’d really appreciate a boost—it gives me energy to keep going.🩵
Now get outta here.

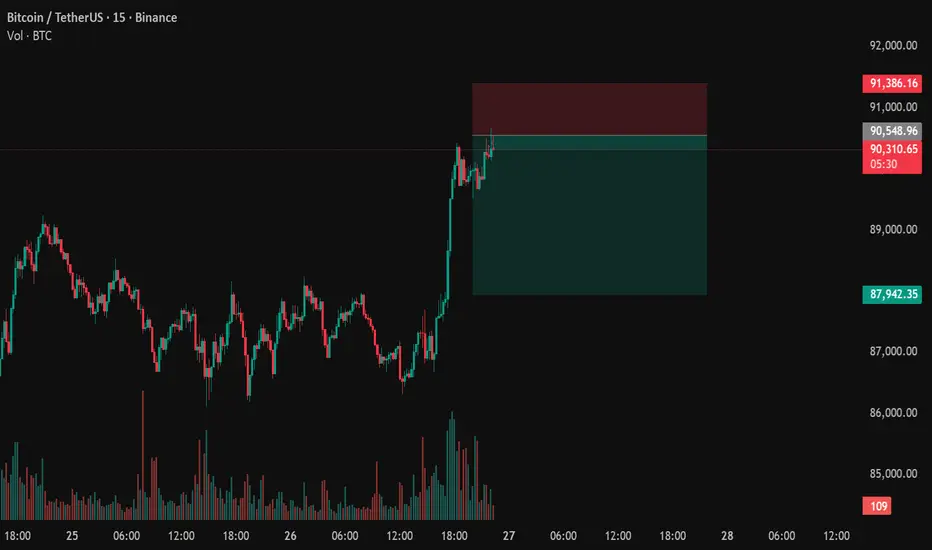
BTCUSDT.P - November 27, 2025On the 15-minute chart for Bitcoin, price is in a strong short-term uptrend, marked by a steep series of higher highs and higher lows culminating in a parabolic push into local resistance around 91,800–92,300. The latest candles show upper wicks and a loss of follow-through, indicating fading bullish momentum and the risk of a pullback. A corrective move toward the nearest intraday support band around 89,700–90,100 would be a normal retracement within the broader advance, and aggressive longs may look to reduce risk while conservative traders wait for a reaction at that support zone before re-entering.

$BTC: Red zone tapped staying defensive.Red zone has been hit, so we need to stay cautious. BTC and alts will remain risky until this level is reclaimed.

BTC Short - Structured ScalpingJoin me on the short side.
My trades are based on a personal setup focused on liquidity and supply–demand dynamics
$BTC: Always think beyond the crowd. CRYPTOCAP:BTC is playing out exactly as expected. Fresh demand and supply zones are marked on chart.
When everyone turns bearish, that’s usually the hint that insiders start getting bullish and when everyone gets bullish, insiders flip bearish.

Bitcoin Analysis – November 26|First real bounce after the dumpHello traders! Hope you're having an amazing day 🚀
Let’s jump into today’s Bitcoin analysis 👇
The Fear & Greed Index is still sitting at 15 today—same as yesterday—and the market is moving exactly in line with yesterday’s scenario.
If you already have an open position, it’s a good idea to secure some profits here 💰.
Now, let’s focus on the current trend. This is the first real bullish leg after the sharp dump we experienced in recent weeks, so keep a close eye on buyer behavior.
Buyers must hold the $88K level they broke above. Dropping back below it would be a strong warning sign of a possible trend reversal ⚠️.
If your strategy gives you a valid trigger, you can look for entries — just stick to proper risk management 📉📈.
Volume is still supporting the bullish move, but after breaking 88K, price is stuck around the 90K level.
A correction could give a cleaner opportunity for a long entry, but remember:
We just printed a strong Marubozu candle — and entering right after a Marubozu usually isn’t ideal because the stop-loss becomes too wide and you lose your 2:1 R/R setup❗
So my suggestion: wait for a pullback before entering a new trade ⏳
And whatever position you take — always secure profits! 🔐
Hope you enjoyed today’s analysis.
Share your thoughts in the comments — I’d love to hear your view! 💬✨