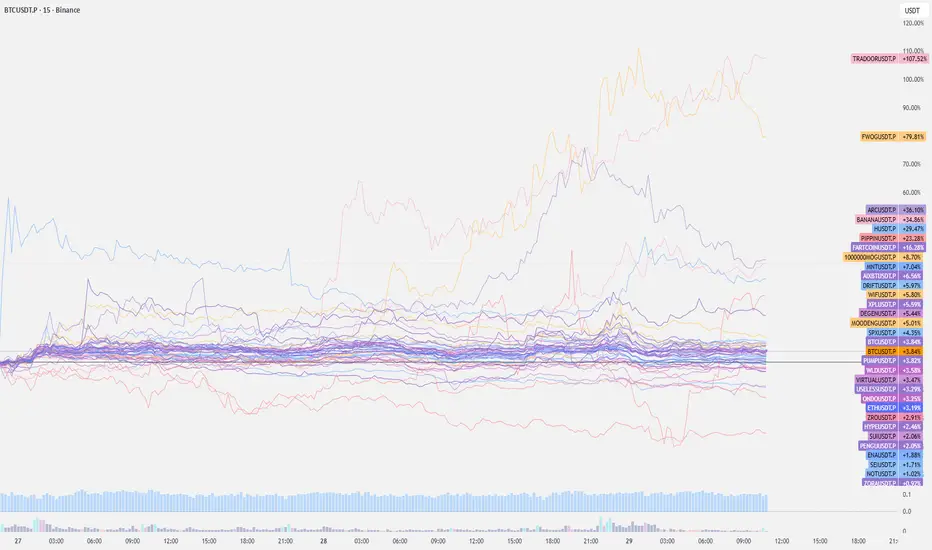
Altcoins - A Shift in Plain SightOne thing that stands out lately is how several mid-caps and low-caps have started to drift above CRYPTOCAP:BTC on relative performance. When BTC sits in the middle of the pack while pockets of alts are steadily printing higher % moves, it usually hints at a rotation brewing.
This kind of spread normally shows up when:
- BTC cools off or ranges after a strong move
- Liquidity becomes more comfortable chasing risk
- Traders start searching for higher beta plays
- Early bids creep in across multiple alt sectors at the same time
You don’t need a breakout or a big narrative to see it — the relative strength alone is a decent tell. When alts cluster above BTC while the rest flatten out, it’s often the first sign that the market is prepping for an alt window.
It doesn’t guarantee a full-blown alt season, but historically this type of structure gives a decent shot at short-term relief rallies or sector pops, especially if BTC remains stable and doesn’t nuke volatility across the board.
For now, the key read is simple:
If you see BTC is no longer the top performer in the group. When that happens, attention tends to rotate outward — and alts usually breathe.
Trade ideas
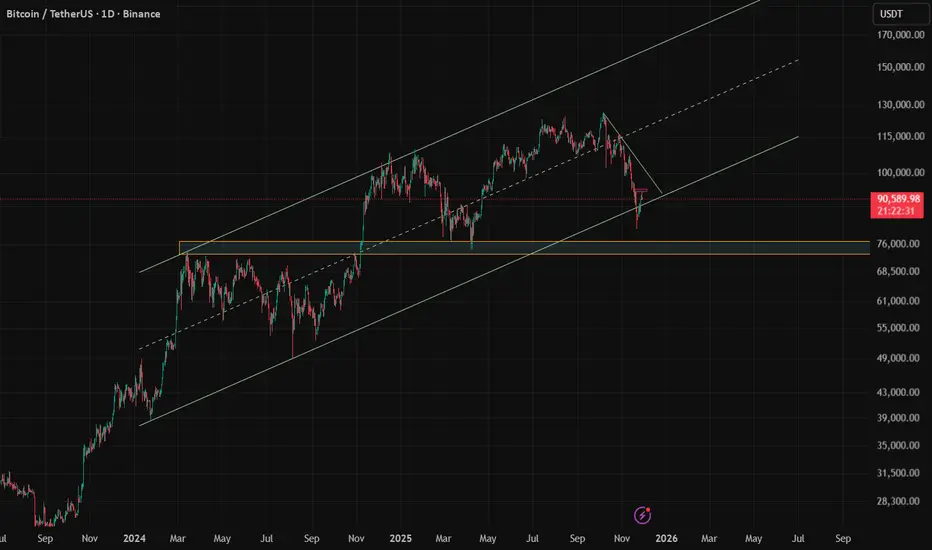
BTCUSD _ Daily
Fake breakout or starting a range!
Price reacted on the resistant area on lower timeframes, expected to touch the resistance line again in near future.
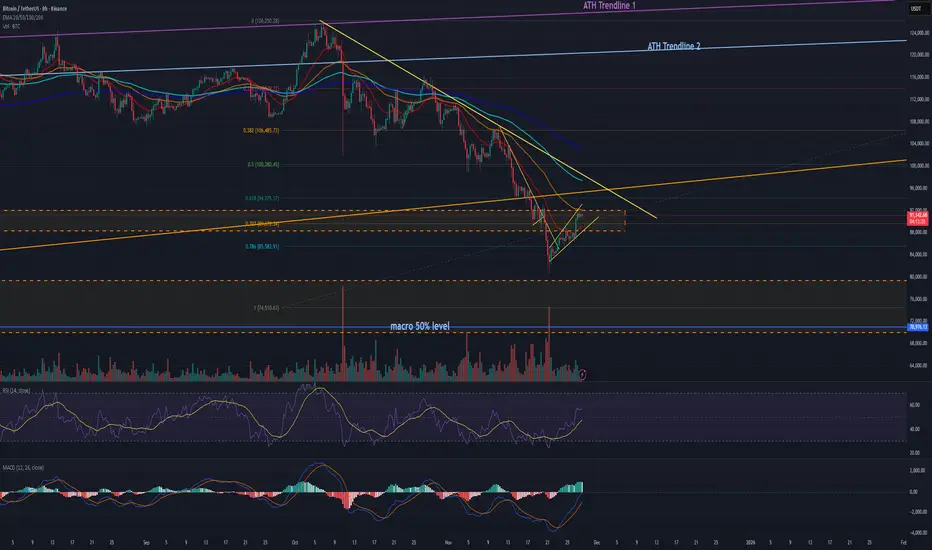
BTC – Why this 25–30% drop doesn’t surprise me (what's next)After making a new ATH above $126k in early October, BTC is now trading around $90k – roughly 25–30% below the highs. On the 4H chart it’s a clean downtrend: lower highs, lower lows, and a break of the prior support zone in the mid-90k area.
For me, this isn’t just “random FUD” – it’s a mix of macro, flows and positioning all lining up:
---- Macro / narrative shift ----
Earlier in the year BTC traded as a “Trump trade”. Recently that narrative has been shaken by tariff headlines and policy uncertainty, while capital attention also rotated toward AI after the Genesis Mission executive order. Less confidence = less appetite for chasing BTC at extremes.
----Spot ETF + on-chain flows ---
U.S. spot BTC ETFs have seen around $3.8B of net outflows in November, removing a big source of steady demand. At the same time:
A Satoshi-era wallet (~12k BTC, ≈$1.4B) moved coins to exchanges.
On centralized venues (especially Binance) we’ve seen billions in net inflows, which usually means more inventory available to sell.
---- Leverage flush-----
The violent October selloff already triggered a record liquidation event (≈$19B in 24h). What we’re seeing now looks like the second phase: spot selling + de-risking after the leverage was washed out.
----- Levels I’m watching on the 4H chart-----
1 - Resistance: 92–93k – former support, now capping bounces.
2 - Support: 80–82k – recent reaction zone, roughly around the 0.618 retrace of the whole bull leg.
3 - Lose 80k convincingly and 70k starts to open up as the next big “magnet” area; reclaim and hold above 93k and we can talk about a deeper relief rally.
Not financial advice – just how I’m trying to connect price action with flows and macro instead of blaming every red candle on “whales” only.

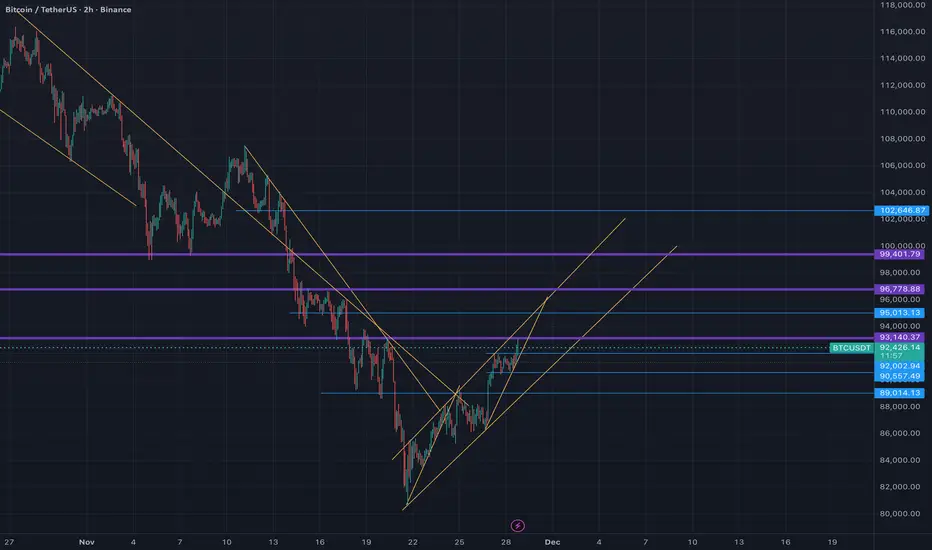
Falling Wedge on the 2H Timeframe: Is a Bullish Breakout BrewingHey TradingView community,
I’ve been closely monitoring Bitcoin’s price action amid this volatile November, and the 2H chart is painting an intriguing picture. After a sharp correction from October’s all-time highs above $126,000, BTC has been grinding lower, but it’s now forming a classic falling wedge pattern – a setup that’s often a precursor to bullish reversals in downtrends.    Check out my screenshot below for the details.
Key Observations from the Chart:
• The Pattern: We’ve got a descending resistance line connecting the lower highs since mid-November, paired with an ascending support line from the recent lows around $88,000-$90,000. This compression is typical of a falling wedge, where selling pressure diminishes, setting the stage for an upside breakout. If it holds, we could see a snap higher, similar to how these patterns resolved in past cycles.  
• Support and Resistance Levels:
• Strong support cluster at $92,000-$92,500 (current price action bouncing here) and lower at $89,000-$90,000, which has acted as a demand zone multiple times this month. 
• Overhead resistance at $96,000-$97,000 (prior highs), with a breakout potentially targeting $100,000-$104,000 based on the wedge’s measured move. On the flip side, a breakdown below $89,000 could open the door to $80,000 or even lower, as some analysts warn of deeper corrections.   
• Momentum Indicators: Volume appears to be drying up in the wedge, which is bullish, and RSI is hovering near oversold levels (around 30-40 on higher TFs), hinting at a potential rebound. No major divergences yet, but watch for one on the next leg down.
Market Context:
November 2025 has been a bloodbath for Bitcoin, with a 33% drop from peaks amid overleveraged longs getting flushed and broader macro pressures.  However, on-chain data shows accumulation by whales, and BlackRock’s ETF flows are turning positive again, suggesting the selling might be exhausting.  Sentiment is numb – perfect for a contrarian setup. Interestingly, ETH/BTC is also breaking out of its own multi-month wedge, which could signal altcoin strength if BTC stabilizes.  
Trading Idea:
• Bullish Scenario: Long on a confirmed breakout above the upper trendline (~$94,000) with stops below $92,000. Targets: $97,000 (short-term), $105,000+ (extended). 
• Bearish Scenario: If support cracks, short toward $85,000-$88,000, but I’d wait for confirmation to avoid whipsaws.
• Risk Management: Always use 1-2% risk per trade. Volatility is high, so position size accordingly. This isn’t financial advice – DYOR!
What do you think, bulls or bears in control? Drop your thoughts below. Let’s discuss!
#BTC #Bitcoin #Crypto #TechnicalAnalysis #FallingWedge #Trading
LONG TRADE (BTCUSDT)ENTRY: 92,300
STOP LOSS: 91,800
TP1: 93,100
TP2: 93,700
RRR: ~2.0:1
1m:
Clear micro breakout above 92,200, followed by tight consolidation and bullish wick reclaim
Structure formed a strong higher low → clean sniper entry near 92,300
Momentum candle confirms bullish intent
5m:
Strong bullish engulfing breakout from prior chop zone
Price reclaimed the 91,800–92,000 zone with follow-through
Volume increase supports breakout structure
15m:
Confirmed higher low → impulsive continuation
Holding above recent key consolidation resistance (~91,800)
Next clean target zone at prior rejection highs near 93,000–93,700

BTC/USDT Analysis. Local Structure Favors Buyers
Hello everyone! CryptoRobotics trader-analyst here with the daily market breakdown.
Yesterday, Bitcoin continued rotating inside the resistance zone at $90,000–$92,300.
Locally, there is a strong probability of a breakout above this range, followed by a move toward the next resistance at $94,000–$97,500 (volume zone). This is supported by the absence of aggressive selling pressure and the way volume is distributed inside the consolidation.
The $90,000 level remains a key pivot point. We still allow for a retest of this level before buyers attempt another upward move.
On a larger scale, once price reaches the next sell zone, we expect a deeper correction to form.
Buy Zones
$90,000 (cluster anomalies)
$88,000–$86,000 (local volume zone)
$84,000–$82,000 (volume anomalies)
Sell Zones
$94,000–$97,500 (volume zone)
$101,000–$104,000 (accumulated volumes)
$105,800–$106,600 (local resistance)
This publication is not financial advice.

BtcBitcoin could experience a short-term decline. It looks like it could return to the $86,000-$85,000 range and reach its highest level.

$BTC Ready for Continuation?CRYPTOCAP:BTC on 30-minute chart is making an inverse H&S neckline is around 91,850.
As many of you know, inverse H&S can act like a trend-continuation pattern.
So here’s the question…
If neckline breaks, do you think trend will continue? 📈
Let’s learn together.

btcusdtBitcoin (BTC) Daily Technical Analysis
Current Market Context:
Price action suggests a bearish intraday bias within the broader context. The setup indicates a potential for a short-term decline towards lower support levels.
Trade Setup Overview:
Direction: Short (Bearish)
Strategy: Fade on strength towards resistance / anticipate breakdown.
Execution Parameters:
Entry Point: $91,630
Rationale: This level is anticipated to act as a point of rejection following a retest of a breakdown level or a minor resistance zone.
Stop-Loss: $92,065
Rationale: Placed just above the recent swing high or a key resistance level. A break above this invalidates the bearish premise and suggests a potential move higher.
Take-Profit Target: $90,365
Rationale: This target aligns with a significant support level where profit-taking or a bullish reversal might occur.
Risk Management:
Risk/Reward Ratio: ~1:4.9
This is an excellent risk-to-reward ratio, where the potential profit significantly outweighs the potential loss.
Position Sizing: Ensure the position size is calibrated so that a loss from this trade remains within your predefined risk tolerance (e.g., 1-2% of total capital).
Technical Justification & Chart Analysis:
This setup implies that Bitcoin is facing selling pressure near the $91,630 - $92,065 zone. A rejection from this area, confirmed by bearish price action (e.g., a bearish engulfing pattern, pin bar, or loss of momentum), could trigger a sell-off towards the $90,365 support level.
The trade's validity relies on the market structure remaining bearish on the lower timeframes (e.g., 4-hour or 1-hour charts). The tight stop-loss requires precise execution.
Conclusion:
This is a high-probability, high-R/R short-term bearish setup. The key to success lies in waiting for confirmation at the entry zone rather than entering blindly. Monitor lower timeframes for bearish confirmation signals before executing the trade.
Disclaimer: This analysis is for educational purposes only and does not constitute financial advice. Trading cryptocurrencies carries significant risk.

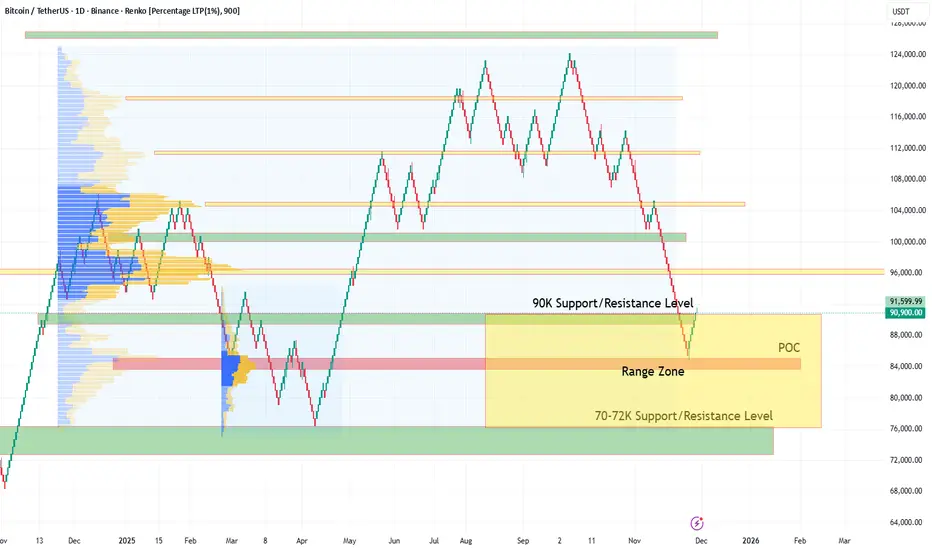
Bitcoin Tests $90K Range High: Binance Netflows Signal PotentialTechnical & On-Chain Outlook:
After losing the $90K support level, Bitcoin has settled into a clear Range Zone between $70,000 and $90,000.
As seen on the technical chart, price action found support near the Point of Control (POC) and is now rallying to test the Range High at $90K.
Binance Netflows: Bearish Divergence Appears
Binance’s 7-day cumulative netflow data highlights a potentially bearish setup:
1. Heavy Asset Inflows (Bearish Signal)
Large amounts of crypto assets have been deposited into Binance:
$2 Billion in BTC
$500M in XRP
$315M in ETH
Such large inflows typically indicate an intention to sell.
2. Weak Stablecoin Buying Power
Stablecoin movements show limited demand:
$1.4B USDT flowed into the exchange
$665M USDC flowed out
➡️ Net stablecoin inflow: ~$735 Million
This represents the actual available buying power on Binance.
Conclusion
A clear supply-demand imbalance is forming:
Potential selling pressure: ~$2.8B (Crypto assets)
Available buying power: ~$0.735B (Stablecoins)
This strongly suggests that short-term investors are preparing to sell at the range ceiling.
Without a renewed wave of stablecoin liquidity, a clean breakout above $90K is unlikely.
A rejection from the range high and continuation within the $70K–$90K range appears to be the more probable scenario.
Bitcoin Analysis – November 28|The Most Important Day of Month!Bitcoin Analysis – November 28
Hello dear traders! Hope you’re all doing well.
Today is November 28, the last active market day of the week — and honestly one of the most important days of the month. Even if bitcoin doesn’t make a big move today, I strongly recommend staying at the charts, because these days often bring unexpected volatility.
The Fear & Greed Index is sitting at 20, which means we’ve moved from Extreme Fear into normal Fear. As you know, the past weeks were dominated by extreme fear.
🟦 Why Today Matters
We’ve seen heavy selling throughout November, but today and the next two days will determine how the monthly candle closes.
Since the major markets will be closed tomorrow and the day after, crypto will likely have lower overall liquidity, meaning today has the highest probability of making the move.
🟧 Market Structure
Daily timeframe: still bearish
1H timeframe: bullish
If today continues upward → 4H may turn bullish as well
Yesterday I explained why this shift can happen — buyers have stepped in with better momentum.
Also note:
After the recent short rally, the market had a time-based correction with very low volume.
A fresh surge in volume today can be a strong signal for continuation.
🟩 Scenario A – Bullish
If 91,636 breaks to the upside:
✅ You can take a long position
• Preferably after a 1-hour candle close above the level
• A 15-minute breakout is acceptable if you see strong volume
• Bitcoin itself is a good option because Bitcoin Dominance is currently supporting the move
-Don’t forget to check the order book on your exchange.”
🟥 Scenario B – Bearish
If 90,786 breaks down:
⚠️ Expect a clean drop
In this case:
→ I recommend shorting BTC pairs that already have a bearish structure
Example: APT, which is currently trending down.
🔑 Final Notes
Always use proper risk management
Avoid unnecessary risky trades
My goal is to keep the analysis as simple and clean as possible
The market rewards traders who show up every day
And to stay in the game every day, you must protect your capital
Have a great day and trade safely! 💙📉📈

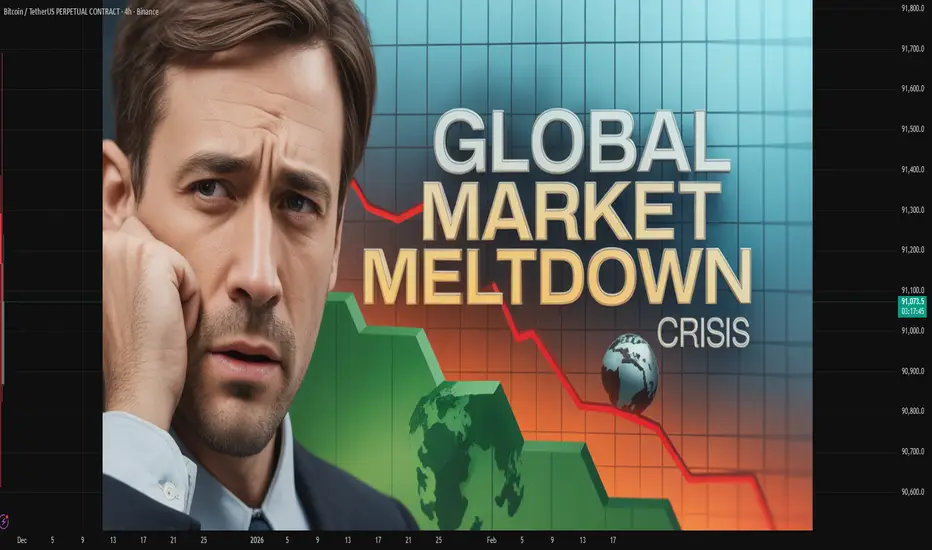
Understanding Global Market Meltdowns and CrisesIntroduction
Global markets are the backbone of the world economy, connecting nations, investors, and industries. They are often perceived as resilient and self-correcting, yet history shows they are prone to sudden and severe collapses known as market meltdowns. These meltdowns are characterized by sharp declines in stock prices, bond markets, and commodities, often accompanied by panic selling, liquidity crises, and systemic financial disruptions. Understanding the causes, mechanisms, and impacts of these crises is essential for policymakers, investors, and businesses alike.
Defining Market Meltdowns
A market meltdown, sometimes referred to as a financial crisis, occurs when the prices of assets drop precipitously within a short period. Unlike normal market corrections, which reflect adjustments based on valuations or economic cycles, meltdowns are marked by panic-driven behavior, loss of confidence, and widespread liquidity constraints. They are rarely confined to a single sector, often triggering a chain reaction across global financial systems.
Historically, major meltdowns include the 1929 Great Depression, the 2008 Global Financial Crisis, and the 2020 COVID-19 market crash. Each had unique triggers but shared common dynamics of excessive speculation, over-leverage, and systemic vulnerabilities.
Causes of Global Market Crises
Excessive Leverage and Debt
Financial institutions, corporations, and households often borrow excessively during economic booms. High leverage amplifies gains during expansions but drastically magnifies losses during downturns. For example, the 2008 crisis was primarily driven by over-leveraged banks investing in subprime mortgages. When defaults rose, the interconnectedness of institutions led to a global liquidity crisis.
Speculative Bubbles
A speculative bubble forms when asset prices soar far above their intrinsic value, fueled by irrational investor optimism. Bubbles are often visible in real estate, equities, and commodities. When investor sentiment reverses, the bubble bursts, triggering rapid sell-offs. The 2000 dot-com crash exemplified this phenomenon, where internet-based companies were massively overvalued before the market collapsed.
Banking System Failures
Banks are the lifeblood of modern economies. A failure in the banking sector can quickly escalate into a financial crisis. Bank runs, where depositors rush to withdraw funds, can destabilize the entire financial system. The 1930s Great Depression was exacerbated by widespread bank failures, causing massive unemployment and contraction in economic output.
Macroeconomic Imbalances
Excessive fiscal deficits, high inflation, or persistent trade imbalances can undermine confidence in financial markets. Investors may withdraw capital from affected regions, causing currency depreciation, stock market losses, and economic stagnation. The Asian Financial Crisis of 1997 was partly triggered by high external debt and currency overvaluation in countries like Thailand and Indonesia.
Geopolitical and Global Shocks
Wars, political instability, pandemics, and natural disasters can act as sudden shocks, triggering market panics. For instance, the COVID-19 pandemic in 2020 caused unprecedented global market volatility as governments imposed lockdowns, disrupting supply chains and consumer demand.
Regulatory Failures and Lack of Oversight
Weak regulatory frameworks, insufficient supervision, or financial innovation without proper oversight can allow systemic risks to build unnoticed. The 2008 crisis highlighted the dangers of unregulated derivatives, which magnified losses and spread risks across global financial institutions.
Mechanisms of Market Meltdowns
Liquidity Crunch
During a meltdown, liquidity—the ease with which assets can be bought or sold—evaporates. Investors rush to convert assets into cash, driving prices further down. Banks may restrict lending to preserve liquidity, exacerbating economic contraction.
Contagion Effect
Financial markets are globally interconnected. A crisis in one region can quickly spread internationally through trade, investment flows, and banking linkages. The 2008 crisis, which started with U.S. mortgage-backed securities, rapidly affected Europe, Asia, and emerging markets due to these linkages.
Panic Selling and Herd Behavior
Human psychology plays a significant role. Fear often triggers irrational selling, creating a self-reinforcing downward spiral. Investors abandon long-term strategies, leading to sharp price declines that are disproportionate to actual economic fundamentals.
Credit Freeze
Banks and investors may hoard cash and reduce lending, causing a credit crunch. Businesses struggle to finance operations, leading to layoffs, bankruptcies, and reduced consumer spending, which further depresses economic activity.
Impacts of Market Crises
Economic Recession
Market meltdowns often coincide with broader economic downturns. Declining asset prices reduce wealth, curtail consumption, and disrupt investment, leading to slower economic growth or outright recession.
Unemployment and Social Consequences
Business failures and reduced investment lead to layoffs, increasing unemployment rates. Social unrest and political instability may follow, as seen during the Great Depression and subsequent economic crises.
Loss of Investor Confidence
Crises shake investor confidence, making markets more volatile and risk-averse. Recovery often takes years, as rebuilding trust is slower than stabilizing balance sheets.
Policy Interventions
Governments and central banks typically intervene through fiscal stimulus, interest rate cuts, or quantitative easing. While necessary to restore stability, these measures may increase long-term debt burdens or inflate asset prices, potentially sowing the seeds of future crises.
Global Ripple Effects
In a globalized economy, meltdowns in major financial centers impact trade, investment, and currency markets worldwide. Emerging economies often bear the brunt of capital outflows, currency depreciation, and reduced access to credit.
Lessons and Mitigation Strategies
Diversification and Risk Management
Investors can protect themselves by diversifying portfolios across asset classes, sectors, and geographies. Proper risk management helps absorb shocks during periods of extreme volatility.
Regulatory Oversight and Transparency
Strong regulation, stress testing of financial institutions, and transparency in financial products reduce the likelihood of systemic risks accumulating unnoticed.
Monetary and Fiscal Preparedness
Central banks and governments must maintain tools to stabilize markets, such as liquidity facilities, interest rate adjustments, and targeted fiscal stimulus to cushion economic shocks.
Behavioral Awareness
Understanding the psychological dimensions of markets—herd behavior, panic selling, and over-optimism—can help investors make rational decisions even in turbulent times.
Global Coordination
Given the interconnectedness of modern markets, international cooperation is crucial to prevent contagion and stabilize financial systems. Institutions like the IMF and World Bank play pivotal roles in crisis mitigation.
Conclusion
Global market meltdowns are complex phenomena with roots in economic imbalances, speculative excesses, regulatory lapses, and human psychology. While each crisis has unique characteristics, their recurring nature underscores the need for vigilance, risk management, and systemic safeguards. Understanding the mechanisms, causes, and impacts of these meltdowns is essential for investors, policymakers, and societies to navigate the volatile terrain of global finance.
By learning from history and implementing robust preventive measures, the world can reduce the frequency and severity of market crises, ensuring more stable and resilient financial systems in the future.
Bitcoin Update — Big Correction, Clear Levels, and What’s NextBitcoin has been in a strong corrective phase ever since the October ATH. After breaking down from the rising structure, price has been grinding lower and finally tapped into the broader demand zone we’ve been watching for weeks.
The recent bounce shows that buyers are still active, but the larger trend remains in “recovery mode,” not full reversal mode yet.
🔍 Current Structure
BTC has been trending inside a descending channel since the ATH
Lower highs continue to form under the yellow resistance line
Price found support inside the orange mid-range demand box
RSI and MACD on 8H/12H are recovering, hinting at short-term strength
Volume on the selloff has calmed, suggesting the worst of the panic may be over
Overall, this is a classic cool-down phase after a major breakout — nothing structurally unusual.
📈 Key Levels to Watch
Support:
$87k–$90k — current holding zone
$78k–$80k — major range low if things dip lower
Resistance:
$98k — mid-range ceiling
$102k–$105k — the first meaningful resistance cluster
$113k — upper diagonal rejection area
As long as BTC stays above the mid-range support, the structure remains healthy. Reclaiming the yellow diagonal would open the door toward $102k+ again.
⚡ What’s Next?
Bitcoin is stabilizing after a multi-week correction, but it hasn’t yet broken back into bullish momentum. The next major move will likely depend on whether BTC:
breaks above the descending resistance, or
retests deeper support before reversing higher.
Either way, the macro trend remains intact — this is still a structured pullback within a larger bull cycle.
Not financial advice — just chart analysis.
BTC — Trendline Rejection or Breakout? BTC is approaching a key structural decision point, and the next move will determine whether we see continuation upward or a corrective sweep to lower liquidity levels. This idea outlines both scenarios with clear targets and educational structure analysis.
Key Structural Areas
1️⃣ Rising Trendline Support
BTC continues to respect a clean ascending trendline. This line has been a major pivot for the past several days.
Price is currently hovering just above it, and the yellow circle marks the confluence of:
Rising trendline support
A local demand block
Prior liquidity sweep zone
This is the most important area to watch for reaction.
2️⃣ Short-Term Rejection Scenario (White Path)
Before breaking upward, BTC may show short-term downside rejection, targeting:
➡️ Short-Term Target:
$88,180
This level aligns with:
Demand block retest
Trendline kiss
Local inefficiencies needing fill
A rejection into 88,180 would be normal and healthy before a potential bullish continuation.
3️⃣ Bullish Reclaim Scenario
If price taps the rejection zone and reclaims the trendline, upside targets remain:
$95,800 – $96,500 → Half-filled FVG + structural supply
$99,500 – $100,200 → Major FVG + macro resistance zone
These zones are where we expect strong reaction and profit-taking.
4️⃣ Breakdown Scenario
If BTC fails the trendline with a full candle close below, expect:
Breakdown of structure
Full sweep of demand
Deeper correction into mid-range levels
Not my primary bias, but it's critical to acknowledge the possibility.
Summary
BTC is sitting on an important trendline.
A quick rejection into 88,180 could be the liquidity grab needed before upside continuation.
Reclaiming the trendline = bullish continuation toward FVGs.
Breaking below = deeper corrective move.
📘 Disclaimer
This analysis is for educational purposes only. It represents personal opinion and not financial advice. Always do your own research and manage your own risk.

Bitcoin Analysis October 2025Bitcoin faced correction after last flash crash where bitcoin had 10% pullback, and it now has nice rally to the upside. Fixed volume range showed accumulation of buying orders. I expect price to push to the previous high on the left.

Bitcoin prediction Nov 2025Bitcoin prediction Nov 2025, Bitcoin is expected to push to the upside after it broke previous high and came to test previous low and bullish order block and start to move toward previous high (Bullish Extension). This move may break previous all-time high and break record of 2025 All-time high.

BTCUSDT: Lower Vectors Cleared, Higher Targets in SightBitcoin has recovered prior vector candle imbalances at the lower levels (marked in green) and is showing signs of strength after retesting the daily open. With cleanups complete below, attention now shifts to the remaining unfilled vectors above (highlighted in purple), ranging from the 6hr to 5min timeframes.
These imbalances act as magnets for price, suggesting a potential path higher toward the $98K–$109K region.
The structure also shows a possible stair-stepping move upward with multiple confluences building around each level. If momentum sustains and liquidity is swept at each leg, we could see these zones get tapped progressively in the coming sessions.

sell limit and buy limt. OCODirection: LONG LIMIT
Entry: $91,250
Stop Loss: $90,800 (below structure & liquidity zone)
Take Profit: $91,950
RR Ratio: 1 : 1.55
OR
BUY STOP Entry: $91,650 (after retest confirmation)
Stop Loss: $91,300 (tight invalidation)
Take Profit: $92,400
RR Ratio: 2.14
DELETE Second order if first one is triggered
M15:
Strong bullish breakout from accumulation zone (~$87,000–$89,000).
Sharp expansion → consolidation phase now near $91,400–$91,600.
Potential formation of a bull flag or reaccumulation.
M5:
Tight price compression after a strong rally.
Micro higher lows forming around $91,200–$91,300.
Clear resistance at ~$91,600.
M1:
Repeated rejections from $91,500–$91,600 zone.
Low timeframe equilibrium building.
Minor liquidity sweep below $91,300 followed by recovery.
I DIDNT PLACE THE SELL LIMIT CORRECTLY ON THE CHART. SL AND TP ARE WRONG. FOLLOW DESCRIPTION

BTC/USDT Technical Analysis, 2025-11-27 17:00 UTC🚀 BTC/USDT Technical Analysis, 2025-11-27 17:00 UTC
📊 Market Context
Type: Technical outlook / Long setup
Potential Entry Zone: 90,800 – 90,870 (Fibonacci Dip Zone)
Potential Upside Level: 94,140
Defined Invalidation Level: 88,765
Approx. R/R Concept: ~1:1.5
📈 Technical Analysis Overview
🔹 Fibonacci Structure
Price interacting with the Fibonacci Dip Zone (~0.382–0.618 retracement)
Historically, this zone has acted as a reaction area for buyers
Current structure shows strong buyer interest and whale accumulation
🔹 Order Flow & Liquidity Context
Whale buy detected: 842,654 USDT
Higher bid activity relative to recent sessions
Liquidity concentration forming near 90,800–90,870
Order book imbalance indicates buyers dominating
🔹 Momentum Indicators
RSI: 44.6, indicating recovery from oversold conditions
Stochastic: 71.9, approaching neutral, supporting early bullish continuation
MACD: Histogram trending upward, buyers gaining control
Volume: OBV trending upward, confirming sustained buying momentum
📊 Volume & Trend Context
Strong net buy pressure (+100% whale dominance)
Volume spikes near support zone confirm buyer accumulation
Momentum and trend alignment suggest bullish continuation if price holds above entry zone
🎯 Key Market Levels
Immediate Support: 90,000
Major Support / Invalidation: 88,765
Zone of Interest 1: 91,500
Zone of Interest 2 / Target: 94,140
Extended Area (if momentum persists): 95,500
⚡ Structural Notes
Market consolidating near Fibonacci Dip Zone after prior bullish leg
Sellers showing reduced follow-through
Multi-timeframe momentum gradually aligning to upside
📘 Trade Planning Concepts (Analysis Only)
Confirmation above 90,870 may indicate stronger buyer intent
Scaling entries possible in volatile environments
Break-even adjustments recommended after hitting 91,500
Partial profit-taking at predefined targets helps manage volatility
⚠️ Risk Framework
Position sizing must follow personal risk rules
Invalidation set at 88,765
Monitor volume for continuation; weak volume may invalidate the structure
Avoid late entries after breakout without pullback
📱 Checklist for Entry
Fibonacci Dip Zone interaction ✅
Whale buy activity confirmed ✅
Momentum indicators supporting bullish continuation ✅
Volume structure aligned with upward attempt ✅
Risk/Reward favorable ✅
🧭 Timeframe & Method
Approach: Short-term / Scalping
Trade Objective: Capture 3–3.6% upside with controlled risk


Bitcoin Long OpportunityBitcoin 👀
After a clear liquidity sweep, price reacted with a bullish expansion, showing that early buyers have stepped in with conviction.
My primary focus is on the buy-side liquidity resting below.
I anticipate a liquidity grab into that area and will look to execute from the M15 unfilled imbalance beneath current price.
On the HTF, we have a strong DOL, supported by an unfilled H1 SIBI, which remains a key objective. 🎯
Also, we have a OTE level of a previous range that aligns with our entry POI - unfilled M15 FVG.
I will consider taking partial profits into the H1 SIBI zone 💰
📉

BTC/USDT Analysis. Sell-Side Absorption in Play
Hello everyone! CryptoRobotics trader-analyst here, and this is your daily market update.
Yesterday Bitcoin followed our long scenario — the move started earlier than expected, without a liquidity grab, as market buyers stepped in aggressively. As of now, price has reached the first resistance at $90,000–$92,300 (volume zone).
In this area, delta has spiked sharply, indicating “high-level buying,” which has already triggered a local correction.
The key pivot level now is $90,000 — it may work as support, but if price settles below it, the level becomes resistance.
If price breaks the local high → expect a test of the upper selling zone and a deeper correction afterwards.
If price breaks and holds below $90,000 → the downside target becomes the anomaly zone at $84,000–$82,000.
Buy Zones
$88,000–$86,000 (local volume zone)
$84,000–$82,000 (volume anomalies)
Sell Zones
$90,000–$92,300 (volume zone)
$94,000–$97,500 (volume zone)
$101,000–$104,000 (accumulated volumes)
$105,800–$106,600 (local resistance)
This publication is not financial advice.
