Bitcoin (BTC): Staying Below $100K | Looks Like Golden Buy Zone?Extreme fear is in the markets; people are losing hope and buyers are being taken out. Yet what we see is a similar pattern forming here, where the 100 EMA is a key zone for us currently.
Each time Oruce has had a dip, it was trading below the Bollinger Bands' middle line, where the bottom was marked near the 100 EMA, and as the price has reached very close to it, we are expecting to see some kind of reversal anytime soon.
If sellers take over the 100 EMA, then we will be officially in a bearish market, in my personal opinion, but as of now, we still have some time and a bullish sense.
Swallow Academy
Trade ideas

BTC Trade Plan 17/11/2025Dear Traders,
👉 **“The crypto market is currently under heavy selling pressure. We have several resistance zones: the first one is the psychological level at 100,000, the second is 103,000, and the third is 110,000. The price will at least reach the first two zones, and considering the large amount of liquidity in the 92–94 area, we can expect a pullback toward those upper zones.”**
Regards,
Alireza!

The market seems to have completed the A wave of the ABC correctI mainly focus on Elliott Wave analysis. The chart has already completed a 5-wave impulse to the upside, and we are now in the ABC corrective phase. It looks like wave A has finished, and the market seems to be entering wave B at the moment.
I'm not sure how high wave B will extend, but I expect it to retrace to 0.382, 0.5, 0.618, or possibly 0.786 before dropping in a 1:1 measured move.

BTCUSDT Review November 17 2025Short-term price movement ideas.
Price has filled the monthly long FVG, which acts as a strong support zone and can trigger at least a corrective move. At the moment, after filling the FVG, we received a daily liquidity grab to the long side, with the next objective being the daily short FVG.
Following the liquidity sweep, a 4H FVG is forming. If price returns to test this 4H FVG and we get confirmation on lower timeframes, then a long position setup can be considered.
Be flexible, adapt to the market, and the results will come quickly. Good luck to everyone.

Lingrid | BTCUSDT Potential Brief Recovery Key Support ZoneThe price perfectly fulfilled my previous idea . BINANCE:BTCUSDT is pressing into the key support zone near 92,000, where price previously created a major reaction and where a fresh bullish divergence is forming. The market structure shows a clean downward channel, but price is stabilizing inside a localized compression at the bottom of the range. A rebound from 92,000 keeps the door open for a short-term rally toward the 100,500 resistance as long as buyers defend the zone. Momentum remains bearish overall, but the divergence suggests a corrective bullish swing is likely before trend direction resumes.
⚠️ Risks:
Breakdown below 92,000 invalidates the bullish rebound and exposes deeper downside.
Strong continuation of the macro downtrend may override divergence signals.
Failed reaction at mid-range resistance could stall the bullish leg earlier than expected.
If this idea resonates with you or you have your own opinion, traders, hit the comments. I’m excited to read your thoughts!

BTC Weekly Update | Still in Uptrend – Next Target 140K to 150KIn the start of 2025 (10 Feb), I shared a #BTC analysis when Bitcoin was trading around 95K, and our buying zone was clearly mentioned between 86K – 79K.
#BTC perfectly touched this zone and gave over 100% return!
Our position is still active and in strong profit.
Now, once again on the weekly timeframe, #BTC is showing a potential AB=CD pattern formation.
Currently, #BTC is moving within the Fibonacci golden zone (0.382–0.5), testing the trend line, and testing the EMA 50, theses are strong technical confluence zones for a bullish continuation.
Spot Trade Plan:
We will accumulate #BTC at CMP (Current Market Price).
Futures Trade Plan:
For confirmation, we will wait for:
A bullish candle on the 1D timeframe
A bullish divergence on the 4H chart
A clear breakout of the resistance zone
Once confirmed, we’ll look for a long setup with proper risk management.
Trend Outlook:
#BTC remains in a strong uptrend, and the next potential target zone could be around 140K – 150K if bullish momentum continues.
What’s your view on #BTC — are you bullish or expecting a deeper correction? Drop your thoughts below!
#BTC #Bitcoin #Crypto #BTCUSD #CryptoAnalysis #TechnicalAnalysis #TradingView #Bullish #ABCDPattern #Fibonacci #Uptrend #EMA50

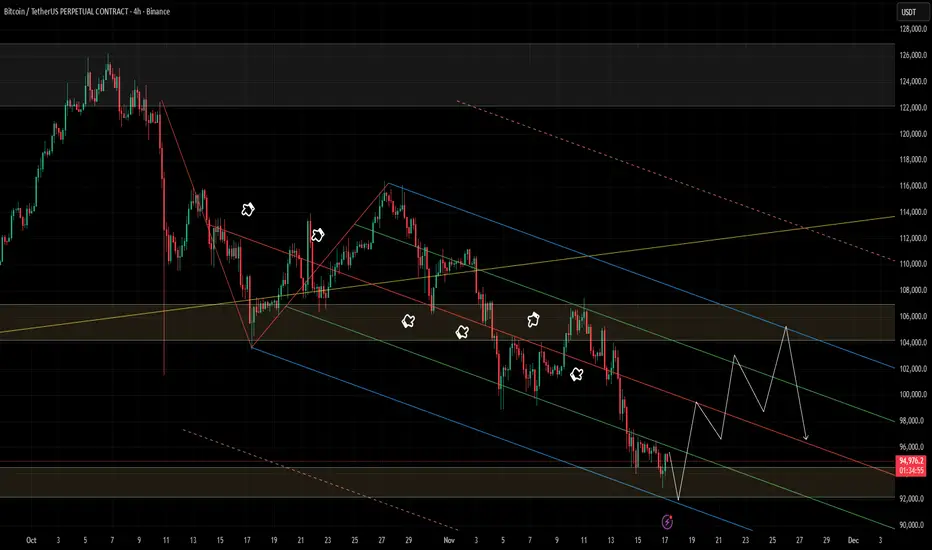
BTC At the Edge of Breakdown or Reversal?!!!Bitcoin has once again tapped the lower boundary of the descending channel, creating a clean liquidity sweep inside a major demand zone. This area has repeatedly triggered strong bullish reactions, and the current price action shows early signs of another potential rebound.
As long as BTC holds above the channel low, a corrective move toward 98K → 102K → 105K remains on the table.
However, the broader structure is still bearish until a confirmed breakout above the red trendline and the upper channel levels is achieved.
Key Levels:
• Support: Channel Low + Demand Zone
• Resistance: Red Trendline, 98K, 102K, 105K
• Bias: Short-Term Bullish Correction, Mid-Term Bearish Structure
📌 Clear invalidation occurs if price breaks down below the channel with a strong close.
BTC Short Term Outlook Potential for a ReboundBTC Short-Term Outlook: Potential for a Rebound
***Warning*** : Personally, my average accuracy (win rate) is around 25-30% , but since this plan has an RRR (Risk/Reward Ratio) of 3:1 , it is still considered a playable setup
Positive Signal: Currently, the price is testing and bouncing off the lower support line of the Falling Wedge (around the 96,000 - 98,000 area). The price holding above this support level is a good sign.
Short-Term Target: The first objective of this rebound is to move up and test the upper resistance line . This aligns with the Take Profit target in your plan (around the ~102000-105000 area).
Strategy: The plan to enter a Long position at this point is, therefore, a strategy based on a Support Bounce. This offers an attractive Risk/Reward Ratio, as long as a clear Stop Loss is in place (e.g., at 90000~92000 as per the plan).

BTCUSDT – Trend Remains Bearish Below 97KPrice is still moving inside a clean bearish trend across all timeframes. Every bounce so far is just a pullback into supply with no real shift in structure. As long as price stays below 96.5K–97K, the bias remains bearish.
Resistance:
• 96.5K – 97.0K
• 98.0K – 98.5K
• 100.5K – 100.8K
Support:
• 93.9K (weak low)
• 92.8K
• 91.0K
Bias: Bearish
Setup: Sell pullbacks into supply
Targets: 94.5K → 93.9K → 92.8K

BTC | Long | Target: 114k - 116kThis technical analysis is for informational and educational purposes only. It does not constitute financial advice. Remember to always research and consult with a professional before making investment decisions. Good luck! 📈💼🚀

History of Global Finance1. Early Civilizations and the Birth of Finance
Finance emerged when humans moved from self-sufficient economies to trade-based societies. Ancient Mesopotamia (around 3000 BCE) had some of the earliest recorded financial transactions. Clay tablets reveal loans, interest rates, and commercial contracts. Temples often served as early financial institutions because people trusted them for storing grain or valuables.
By 2000 BCE, Babylon introduced the Code of Hammurabi, which defined rules for lending, interest ceilings, and collateral. Ancient Egypt, India, and China developed sophisticated tax systems and land-based financial structures. In India, the concept of hundi (a traditional credit note) shows that instruments similar to cheques existed thousands of years ago.
2. Classical Antiquity: Trade, Coins, and Banking
Finance expanded dramatically in the Greek and Roman eras. Greeks introduced coinage, enabling standardized trade across the Mediterranean. Private bankers, or trapezitai, facilitated currency exchange and safe storage.
Rome built a vast financial system supported by taxes, trade routes, and military spending. Roman bankers issued loans, managed estates, and helped finance public infrastructure. The fall of the Roman Empire (5th century CE) led to economic fragmentation, but financial knowledge later revived through trade networks.
3. The Middle Ages: Commercial Revival
Between the 10th and 15th centuries, Europe saw a financial renaissance. Italian city-states like Venice, Genoa, and Florence became financial hubs. The Medici Bank, established in 1397, was one of the world’s first multinational banks. It pioneered double-entry bookkeeping, which remains the backbone of accounting.
Trade fairs in Champagne and maritime routes across the Mediterranean expanded international commerce. Bills of exchange replaced risky cash transport, allowing merchants to conduct long-distance transactions more securely.
Simultaneously, the Islamic world developed advanced financial systems. Muslim traders used letters of credit (sakk, origin of the word “cheque”) and profit-sharing investment models, influencing global financial practices.
4. The Age of Exploration and Early Capitalism
From the 15th to 17th centuries, European powers explored new regions, connecting continents through trade. This era marked the rise of mercantilism, where governments tried to accumulate wealth by controlling trade.
Several major financial innovations arose:
Joint-stock companies, such as the British East India Company (1600) and Dutch East India Company (VOC, 1602), issued shares to finance overseas expeditions.
The Amsterdam Stock Exchange (1602) became the world’s first formal stock market.
International banking families (Rothschilds, Fuggers) provided loans to monarchs and governments.
These developments laid the foundation of modern capitalism and global trade finance.
5. Industrial Revolution: Birth of Modern Finance
The 18th and 19th centuries saw rapid industrial growth driven by technological advancements. Finance evolved to support large-scale industries, railroads, and global trade. Key developments included:
Central banks like the Bank of England (1694) gaining greater importance.
Expansion of corporate finance to fund factories and infrastructure.
Growth of insurance companies (e.g., Lloyd’s of London).
International gold standard adoption in the late 1800s, stabilizing global currency exchange.
The gold standard helped global trade flourish because currencies became reliably convertible into gold, minimizing fluctuations.
6. Early 20th Century: Crises, Wars, and Reconstruction
The early 1900s were turbulent for global finance. World War I shattered the gold standard, leading to inflation and debt crises. Attempts to reinstate gold in the 1920s failed, and the Great Depression (1929) exposed weaknesses in global financial regulations. Stock markets collapsed, banks failed, and world trade shrank dramatically.
After World War II, the global community rebuilt the financial system to avoid another crisis. The Bretton Woods Conference (1944) created three major institutions:
International Monetary Fund (IMF)
World Bank
General Agreement on Tariffs and Trade (GATT), later the World Trade Organization (WTO)
A new system pegged currencies to the US dollar, which itself was pegged to gold. This structure brought stability and encouraged global economic recovery.
7. Post-Bretton Woods Era: Floating Currencies and Finance Globalization
In 1971, the US abandoned the gold convertibility of the dollar, ending the Bretton Woods system. Currencies began floating, shifting based on supply and demand. This sparked new financial markets:
Forex (foreign exchange) became the world’s largest market.
Derivatives such as futures, options, and swaps gained popularity.
Petrodollar recycling emerged as oil exporters lent surpluses to global markets.
The rise of multinational corporations accelerated cross-border investments.
Information technology transformed financial services, enabling global trading, electronic settlements, and instant currency conversions.
8. Deregulation and Financial Innovation (1980s–2000s)
Many countries relaxed financial restrictions during the 1980s and 1990s. Deregulation allowed banks, investment firms, and insurance companies to merge into “financial supermarkets.” Key developments included:
Leveraged buyouts and corporate restructuring.
Growth of hedge funds and private equity.
Expansion of mortgage-backed securities and other complex financial instruments.
Globalization of stock exchanges, with London, New York, Tokyo, Hong Kong, and Singapore becoming major hubs.
This era accelerated financial innovation but also increased systemic risk.
9. The 2008 Global Financial Crisis
The global system faced its worst crisis since 1929 when the US housing bubble burst. Banks had heavily invested in mortgage-backed securities and derivatives tied to risky loans.
When borrowers defaulted, major financial institutions collapsed or needed rescue. The crisis spread globally due to interconnected markets. In response:
Governments injected trillions in bailouts.
Regulators introduced stricter policies (Basel III, Dodd-Frank Act).
Central banks used quantitative easing to stabilize markets.
The crisis highlighted the dangerous side of financial interconnectedness.
10. The Digital Era: Fintech, Crypto, and Global Integration
Since the 2010s, finance has become more digital and global:
Fintech companies disrupted traditional banking with mobile payments, online lending, and automated investing.
Blockchain and cryptocurrencies emerged as decentralized alternatives to traditional finance.
High-frequency trading uses algorithms to execute trades in microseconds.
Global capital flows intensified, linking emerging and developed markets.
COVID-19 (2020) further accelerated digital finance while prompting historic levels of government stimulus and monetary expansion.
Conclusion
The history of global finance is a story of continuous evolution—from ancient trade networks to the modern digital economy. Each era brought innovations that reshaped how the world saves, invests, trades, and grows. Today’s global financial system is more interconnected than ever, offering immense opportunities—and significant risks—for individuals, investors, corporations, and nations. Understanding its history helps make sense of current trends and future challenges.

The Prop Trader’s Guide: Win Challenges. Keep Funding. Scale upHey Traders, today we are going to look at the prop trading. It can be solution for traders who has tested and proven their strategies. In this article, we’ll break down the risk rules that keep traders funded, the habits that build consistency, and the mindset that separates steady growth from emotional gambling. If you can master this part of the game, the rest becomes much simpIer.
1️⃣ You must have your strategy well defined and proved on your capital. Prop firms are not solution to the poor financial situation. If you dont trade well and consistently on small capital, bigger capital is not solution. First you need to solve this and have strategy with good winning ration and risk reward. You can check my one. for inspiration I have described it in this post below.
👇 Click the picture to learn more 2️⃣ Understand that in prop firms you are not trading real capital. They just sold you a demo with strict rules and if you pass and earn, they will pay you from what they earned on others who lost challenges. Hence rules are set such that it's not easy to pass and keep the account - but it's not impossible if you adapt.
3️⃣ $100K capital is not $100K if your maximum drawdown is 10%. In the fact your account is 10K - the amount you can really risk. Hence making 10% to pass first phase with 10% max drawdown equals making 100% gain. And second phase 5% adds another 50%. So to get funded you literally need to make 150% not 15%.
📍 If we know that 90% of traders , loose 90% of capital in 90 days on the normal accounts. What will be statistics of prop firms ? Even worse. But you have a chance. if you have a good winning ratio. Which you achieve by filtering just to the best trade setups. I have made it multiple times and still Im funded in Crypto and Forex prop firms. Most important think it this game is risk management. But before I will explain my dynamic risk management for each phase and funded account I give you some tips from my experience.
🧩 Essential Rules for Prop Trading
🧪 1) Its not a straight forward game
You must be ready to loose challenge and have money to buy another one. Don't expect get funded and keep the account forever. Unless you will risk 0,1% per trade. We want risk more, because you don't want spend passing challenge for a year. At some point you can loose account even with a good risk management. I lost over 30 challenges in different phases and funded accounts. My total investment was not small, but I withdrew multiple times more in 2025.
🧪 2) Reduce number of trades - Take only best trading setups
I trade less on prop account than on my personal accounts. I take there only A+ setups the ones which are obvious and Im confident to taking them. In the fact I should trade like this on my personal ones also, but I trade more often.🤷♂️
Don't fall for a trap to trade every day every move up and down. Have your routines. For your inspiration you can check this article 👇 Click the picture to learn more 🧪 3) Grow prop capital not % gains
If you would be hedge fund manager who deliver 3% a month consistently you would be considered as top star trader. However we as retail traders want more. Because we mostly don't have bilion dollars portfolio's. But if you work well in prop trading 3% Is life changing and its actually not difficult to achieve.
⁉️ How to achieve a 3% a month
Is 3% gain a month difficult ? If you risking 0.5% per trade with 1:2 RR it actually means That you must win just 3 trades. Now look at your Trade journal, you definitely had 3 good wins in a month. Only thing you need to do is to eliminate those other unnecessary trades.
$ 100K Funded account - 3% gain - 80% Profit split = $2400 payout
How to make more ? Don't go for bigger % gains. Get another funded accounts and build your capital. If you pass another 4 x $100K challenges you will get $500K AUM capital. Then with your 3% gain and 80% profit split = $12 000 payout.
Then you reinvest and you aim for $1000 000 funding to aim for $20K a month with making 3% a month.
🧪 4) Be patient and have a long term vision
Don't expect this happen in month or two. Write down your plan how you will acquire and will work on your prop trader career. Getting funded $1000 000 is a work for at least a year.
🧪 5) Don't trade all challenges at the same time
Yes you will be missing profits if you doing well, but if you loosing it will be affecting your portfolio completely. Take trades separately. I trade each pair on different props and Crypto also separately in the different prop firm.
🧪 6) Start with small $10K account to practice
Trading is performance discipline, dont put yourself under the stress by buying $100K or $200K challenge on the beginnings. Start with $10K just to practice and trade within their rules. Once you pass these easily you are ready to go big.
🧩 Dynamic Risk management for the Prop trading
When it comes to successfully passing Crypto prop challenges, an effective risk management strategy is crucial. Finding the right balance between risking too little and too much is key. Both extremes have their downsides; risking too little may result in prolonged evaluation phases while risking too much can lead to blowing through challenges quickly and struggling with the emotional aspects of trading.
Therefore, you can employ a dynamic risk management approach that combines the strengths of both methods. The specific risk management protocols may vary within different phases of the funded account, typically consisting of two evaluation phases and the funding stage upon successful completion of both.
1️⃣ The 1st Challenge Phase:
In this phase, where a 10% profit target is required for quick progress, you can adopt an aggressive risk management approach. With the following dynamic risk management
Start with risking 0.5% per trade
if your balance increases +1% increaser risk pert trade to 1%
if your balance increases +3% increaser risk pert trade to 1.25%
if your balance drops back to 0% reduce risk to 0.5% If your balance drops below 3% reduce risk per trade to 0.25%
If your balance drops below 5% increase risk to 1%
You might wonder why the risk per trade increases to 1% even when the drawdown exceeds 5%. This is to minimize time opportunity costs. Rather than slowly trading out of drawdown, you can prefer to increase risk and attempt to either break even quickly or accept the possibility of losing the challenge.
If you can not afford to lose a challenge, sticking to lower risk like 0.25% per setup until the account returns to break even might be a better option.
2️⃣ The 2nd Evaluation Phase – Verification
Once phase 1 is completed, and a lower profit target is required, a less aggressive risk management approach is employed:https://www.tradingview.com/x/Lrf4f1XO/ Aim to keep our time-based opportunity costs relatively low in the 2nd evaluation phase. Losing the 2nd phase account would mean having to repeat the 1st phase, which is why we adopt a more cautious approach and strive to minimize potential drawdown.
Risk is only increased when we have a cushion of at least +2%. If the drawdown falls below -2%, we maintain a risk of a quarter percent until the drawdown is fully recovered and back above the -2% threshold. This approach is designed to create a balance between preserving capital and meeting the objectives of the 2nd evaluation phase.
🎯 The Funded Account:
In the funded account, where both phases have been passed, preserving the account becomes the top priority, followed by receiving the first pay-out and refund of the signup fee. Funded accounts should be approached conservatively, and the risk management protocol is adjusted as follows:https://www.tradingview.com/x/QncyMGOz/ Lowering the risk per setup as the drawdown increases serves as a protective measure to prevent breaching the maximum drawdown rule. This approach may result in a longer process of trading out of drawdown, but it is a more favorable alternative to losing the account Completely.
As mentioned, your goal should be build longterm big capital and diversify between prop firms. For instance, you might allocate one account for swing trades and another for day trades. This diversification is just one example; there are various possibilities to explore.
👉 Prop Firms Selection
Opening a prop firm is easy, you just need couple thousands and you buy complete setup with platform and system. Then you start selling demo accounts. Hence there is thousands of prop-firms these days. You want to go just with the serious ones. Which means not the easiest conditions and not the cheapest challenges. But these will most likely last longer.
‼️ Avoid Prop firm which has:
- Cheap challenges or massive discounts
- Easy conditions to pass challenges
- Trailing Drawdown rules
- Too big profits splits
- Too many consistency rules
- Restrictions trading news
- Too many bad reviews (they will most like have more good reviews than bad - its Fake)
- If you Trade Crypto look for prop firm on Crypto exchange. Not in CFD broker.
Trading is not easy and prop firms makes it even more difficult, but its not impossible.
Expect failures and frustration on your journey. You can handle it, you will handle everything, you will always find solution. Keep going re-invest profits and build portfolio.
Main goal is to build personal account from their money without their rules.
Good luck
David Perk aka Dave FX Hunter

Buy the Fear: Top 5 Reasons to Buy Bitcoin at the Bottom Buy the Fear: Top 5 Reasons to Buy Bitcoin at the Bottom Right Now
The headlines are grim. The charts are painted red. The crypto Twitter euphoria has been replaced by a deafening silence.
It’s in these moments of maximum pessimism, when it feels like the entire market is throwing in the towel, that the greatest fortunes are often built.
While buying at the peak of a bull run is driven by FOMO (Fear Of Missing Out), buying at the bottom is an act of conviction and discipline. It’s not for the faint of heart, but for the
strategic investor, a market bottom represents a generational buying opportunity.
If you’re considering stepping in when others are stepping out, here are the top 5 reasons
to buy Bitcoin right now.
1. The Halving is on the Horizon
This is Bitcoin’s built-in economic catalyst, and it’s one of the most powerful forces in its ecosystem. Approximately every four years, the reward that Bitcoin miners receive for
validating transactions is cut in half. This event, known as the "halving," directly reduces the new supply of Bitcoin entering the market.
Think of it as a scheduled supply shock. History doesn't repeat itself, but it often rhymes. The previous three halvings (in 2012, 2016, and 2020) were each followed by monumental
bull runs that sent Bitcoin to new all-time highs. With the next halving expected in 2024, we are on the precipice of another major supply reduction. Buying before this scheduled
event positions you perfectly to benefit from the potential supply and demand imbalance that has historically followed.
2. The "Crypto Winter" Always Thaws
Crypto markets are cyclical. They are characterized by intense periods of growth (bull markets) followed by painful, but necessary, periods of contraction (bear markets). This
"crypto winter" serves a vital purpose: it flushes out weak projects, excessive leverage, and unsustainable business models, leaving the ecosystem stronger and more resilient.
We’ve seen this movie before. The 2018-2020 bear market saw Bitcoin drop over 80% from its high. Those who bought during that despair were handsomely rewarded in the
subsequent cycle. The current downturn, while painful, is part of this natural market rhythm. Winter doesn't last forever, and the spring that follows tends to see the strongest
growth. Buying now means you're acquiring assets before the thaw begins.
3. Unshakeable Long-Term Fundamentals Are Stronger Than Ever
Forget the short-term price noise for a moment and look at the foundational pillars supporting Bitcoin:
Digital Scarcity: There will only ever be 21 million Bitcoin. This fixed, predictable supply makes it a powerful hedge against the infinite money printing of central banks worldwide.
Growing Institutional Adoption: Major companies like MicroStrategy, Tesla, and a growing list of public and private institutions are adding Bitcoin to their treasury reserves. This isn't speculative day-trading; it's a long-term bet on a new digital asset class.
The Store of Value Narrative is Solidifying: In an era of geopolitical uncertainty and inflationary pressures, Bitcoin continues to prove its worth as "digital gold"—a decentralized, borderless, and censorship-resistant store of value.
These fundamentals haven't disappeared; they've become more entrenched. A low price doesn't mean a broken thesis; it means a discounted entry point.
4. Maximum Fear Signals Maximum Opportunity
Legendary investor Warren Buffett famously advised to "be fearful when others are greedy, and greedy when others are fearful." Right now, the market is drenched in fear. This is
quantifiable through metrics like the Crypto Fear & Greed Index, which has been languishing in "Extreme Fear" or even "Neutral" territory for months.
This pervasive pessimism is your best friend. It means the "weak hands" have already sold, and the assets are being transferred to the "strong hands" who believe in the long-term
vision. When there is no one left to sell, even a small amount of new demand can cause a
significant price increase. By buying when fear is at its peak, you are effectively going against the herd and positioning yourself for the eventual return of optimism.
5. The Dollar-Cost Averaging Advantage of a Lifetime
Trying to time the absolute bottom is a fool's errand. The smarter strategy is to use a market bottom as a prime zone for Dollar-Cost Averaging (DCA). By investing a fixed
amount of money at regular intervals (e.g., weekly or monthly), you smooth out your purchase price and avoid the risk of investing one large lump sum at a temporary peak.
A prolonged bear market is a DCA investor's dream. It allows you to accumulate a significant Bitcoin position at heavily discounted prices over time. When the market
eventually recovers and reaches new highs, your average entry price will be so low that
your returns could be exponential. You're not trying to catch a falling knife; you're systematically building a position in a foundational asset at a fire-sale price.
The Bottom Line
Buying at the bottom requires courage, a long-term perspective, and a steadfast belief in the underlying technology. It’s uncomfortable, and it will often feel like you’re making a mistake—until you’re not.
The combination of a looming supply shock, proven market cycles, rock-solid fundamentals, extreme market fear, and the strategic power of DCA creates a compelling
case for action. While the path may be volatile, for those with the fortitude to look beyond the daily charts, this isn't a moment of panic—it's a moment of profound opportunity.
Disclaimer: This article is for informational purposes only and does not constitute financial advice. Please conduct your own research and invest only what you are willing to lose. Cryptocurrency markets are highly volatile.

Bearish BTC idea 17 Nov 2025The W BISI turns into an iFVG (rex box), I want to see price find resistance at the iFVG and then distribute toward the W BISI below (blue box).

Support and resistance key guide (Volume, Trendlines, FVG, MA)Support and resistance key guide (Volume, Trendlines, FVG, MA)
1️⃣ Importance of Support and Resistance in Highly Volatile Crypto Markets
The cryptocurrency market operates 24/7/365, exhibiting far greater volatility than traditional financial markets. This volatility presents substantial profit opportunities, but it also triggers intense fear and greed among investors, creating significant psychological stress.
Support and resistance serve as key milestones in this chaos, signaling zones where price reactions are likely. Beyond mere technical analysis, they reflect the collective psychology of countless traders. Understanding them is essential for success in crypto trading.
2️⃣ The Nature of Support and Resistance and Their Psychological Basis
Support and resistance occur where buying and selling pressures strongly collide, slowing or halting price movement.
Support:
At this level, buyers see the asset as "cheap enough!" and stand ready, forming a psychological and physical barrier against further decline. Additionally, traders previously trapped in losing positions may sell at breakeven, adding resistance against further drops.
Resistance:
At this level, sellers perceive the asset as "expensive enough!" and offload positions, while traders previously trapped at highs may sell with a "better late than never" mindset, limiting upward movement.
※ Meaning of Support/Resistance Breakouts and “Fakeouts”:
When a support level is breached, existing buyers may panic and trigger stop-loss selling. Conversely, breaking resistance may prompt buyers to enter, accelerating the trend.
However, some breakouts can be “fakeouts,” designed to exploit trader psychology. Premature chasing of such moves should be avoided.
3️⃣ Key Support and Resistance Pattern Analysis
📈 Trendlines and Consolidation Zones: The Psychology Behind Market Order
Trendlines: Trendlines visually represent the shared expectation among traders that price will move in a certain direction. Touching an upward trendline triggers “buy at a bargain” psychology, while touching a downward trendline triggers “it can’t go higher” sentiment.
Consolidation Zones (Boxes): These are zones where buying and selling pressures balance each other. Traders plan trades around these zones, dominated by the “waiting for breakout” psychology to capture significant moves.
📈 FVG (Fair Value Gap): Market Inefficiency and Smart Money Footprints
FVGs occur when the market moves too rapidly through a price range, leaving a “price gap.” They often reflect sudden activity by smart money (institutions, whales).
Gap Filling:
Markets instinctively avoid leaving incomplete states (FVGs) unaddressed. When price re-enters an FVG zone, the players who drove the prior rapid move may close or re-enter positions, forming support/resistance. Beginners can treat FVGs as smart money footprints and follow their activity strategically.
📈 Moving Averages (MA): Collective Psychology and Trend Direction
Moving averages reflect the average price perceived by the market over a period. Being widely monitored, they act as psychological support/resistance levels.
Short-term MA (e.g., 50MA): Reflects short-term trader sentiment. Price below it can trigger “short-term trend broken?” anxiety, while above it fosters optimism.
Long-term MA (e.g., 200MA): Represents long-term trader psychology and trend direction. Price below 200MA creates fear of a long-term downtrend, while above inspires hope of a sustained uptrend. When acting as support/resistance, MAs carry strong psychological consensus as a widely observed benchmark.
📈 POC (Point Of Control) Volume Profile: Market Consensus and the Power of Volume
POC is the price level with the highest traded volume over a period. It indicates market agreement on price, with substantial volume concentrated there.
Price below POC: POC becomes strong resistance. Buyers trapped in losing positions may sell at breakeven, and sellers actively resist upward moves.
Price above POC: POC acts as strong support. Buyers believe “price won’t fall below this level,” and prior sellers may switch to buying.
POC represents the market’s “expected price” and the zone where loss-aversion psychology is strongest.
📈 Fibonacci: Natural Order and Human Expectation
Fibonacci retracements apply golden ratio mathematics to charts, reflecting the expectation that price will reverse at certain levels, forming support/resistance.
These levels are not coincidental; many traders plan trades around them, causing real market reactions.
Levels like 0.5 (50%) and 0.618 (61.8%) are psychologically significant, viewed by traders as buying or selling opportunities. Support/resistance forms through “herd psychology,” as many act in unison.
📈 CME Gap: Institutional Moves and Market Regression Instinct
CME gaps occur in Bitcoin futures dominated by institutional investors. They happen when the spot market moves over weekends while futures are closed, and the market tends to “fill the gap.”
Gap Filling: CME gaps represent periods without institutional activity, prompting the market to normalize these “abnormal” price zones.
Traders anticipate “the gap will eventually be filled,” making these zones potential strong support/resistance, reflecting future-oriented market psychology.
4️⃣ Managing Trading Psychology Using Support and Resistance
Even the best tools are ineffective without psychological discipline.
Confirmation bias and stop-loss discipline: Ignoring losses due to selective perception leads to ruin. When support breaks, acknowledge your prediction was wrong and act decisively to exit.
Overbought/oversold psychology and FOMO:
Avoid chasing price surges out of fear of missing out (“everyone else is profiting, why not me?”).
During crashes, resist panic selling at the bottom. Base trades on your rules derived from support and resistance.
Partial trading for risk management:
Avoid buying all at support or selling all at resistance at once. Splitting trades across multiple support/resistance levels provides psychological stability and reduces the impact of wrong predictions.
5️⃣ Comprehensive Strategy Formation and Practical Application Tips
Multi-level Support/Resistance Confluence: Overlapping zones (e.g., Fibonacci 0.618 + 200MA + POC + FVG bottom) create very strong support/resistance. These reflect collective trader agreement and can be traded with higher confidence.
Volume Analysis and Support/Resistance Strength: High volume at a zone confirms its significance. Reliable breakouts require strong volume, showing market participation and intent.
Develop Your Own Trading Plan: Don’t blindly follow all patterns. Choose indicators and methods that suit you to establish personal trading rules. Adhering to these rules maintains psychological stability and long-term success.
If you found this content helpful, please show your support with a Boost (🚀) and a comment (💬)! Your encouragement is a great motivation for us to create better analyses and content. You can also follow us to receive notifications about new posts.
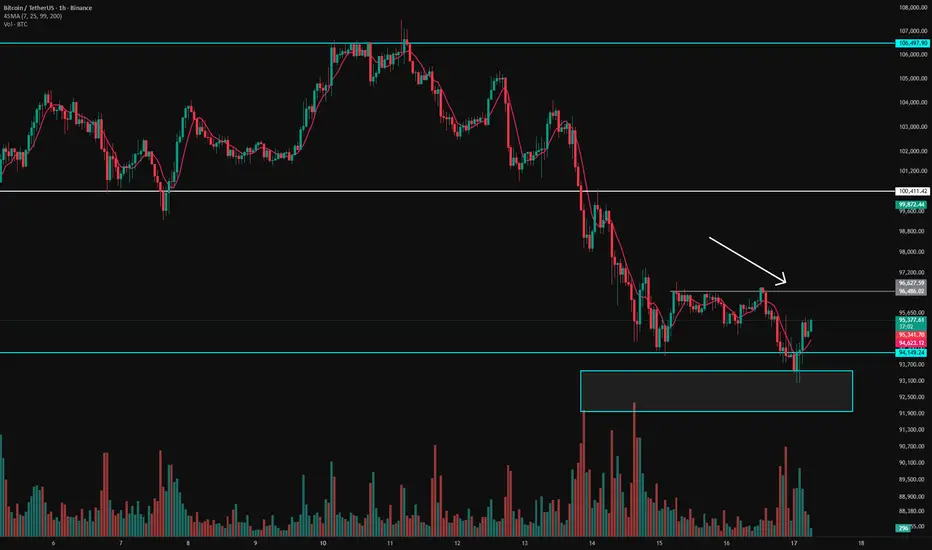
Bitcoin Daily Analysis – 1H Timeframe Breakout Watch!
Hello dear traders! Hope you’re having a great week so far and starting it strong! 🌟
Let’s break down today’s 1-hour Bitcoin analysis.
As you can see on the chart, BTC made a fakeout below the $94K level, and just like I mentioned in the previous analysis, this level is unbelievably important. If you haven’t checked that one yet, I strongly recommend taking a look — the conclusion was based on weekly support, resistance, and Fibonacci confluence. 📊✨
🔥 What Happened Today?
Even though sellers showed strong momentum with sharp-volume candles during the breakdown attempt,
they failed to reclaim $94K — buyers stepped back in and protected the level! 💪🟢
This is a positive sign for a potential short-term correction against the strong weekly downtrend we’ve been seeing.
BUT… higher timeframes still don’t give us a clean trend direction, so buyers must prove their strength once more.
That’s why I’ve marked a key level on the 1H chart:
➡️ $96,500
A break and 1-hour candle close above $96.5K could be the first real sign of a shift in structure — the first higher high + higher low setup on this timeframe. This level is important enough to justify a controlled, small-risk position.
⚠️ However… Be Cautious!
Short-term momentum still favors sellers, so it’s not a spot to take heavy risks.
I personally will use minimum risk if I take a position here.
📉 BTC Dominance (BTC.D) – Critical Factor
BTC dominance is super important right now.
Historically:
When BTC rises → Dominance drops → Altcoins pump harder 🚀
When BTC dumps → Dominance rises → Altcoins crash harder 💀
So it’s worth keeping an eye on alts during these moves.
🧠 My Personal Plan
I currently have one position on altcoins, and I will open another position on Bitcoin ONLY IF
➡️ 1H candle closes above $96,500
Why?
Because BTC dominance’s long-term direction is still unclear.
By splitting my risk between an alt and BTC, I increase my exposure without overleveraging or over-risking.
💡 My Recommendations for You
✅ First — NEVER trade without risk management.
✅ Second — This is NOT the time to take big risks.
Right now:
Monthly → buyers in control
Weekly → unclear
Daily → sellers in control
No side has a strong enough confirmation yet, so trade with caution.
Thanks for reading this analysis! 🌙
Always remember: the market has zero certainty. Your goal is to stay long enough in the game to build experience — that’s how you become consistently profitable.
I’d love to hear your thoughts in the comments below! 😊💬📊