BTC/USDT 4H chart review📉 1. Market structure – short-term 4H trend
In the chart I see:
• Breaking the upward trend line (black diagonal) – a classic signal of weakening momentum.
• After the breakout, there was a quite strong downward impulse, which confirms that the intraday trend has turned bearish.
• The price is currently testing around USDT 89,500-90,000, where a reaction is emerging, but not strong yet.
👉 Conclusion: 4H is now in a bearish correction and the market looks ready to test further lower supports.
⸻
🧭 2. Support and resistance levels (from your chart)
Upcoming supports:
1. 89,500–89,000 – the current level at which the market is trying to defend itself.
2. 88 185 – clear red line, first logical support lower.
3. 86,001 – next demand level, big candle from the past.
4. 83,720 – deeper support to which the market returns when there is great fear.
The nearest resistances (which need to be recovered to return to growth):
1. 90,467 – first key resistance; now it will work as a "flip".
2. 91 923 – stronger resistance; This is where the declines began.
3. 94,223 - only breaking this level shows that the bulls are back.
👉 The market is currently sitting BELOW the key resistance of 90,467, so downward pressure is active.
⸻
📉 3. Analysis of candles and price behavior
• The last 4-6 candles are large red bodies, which shows the clear dominance of supply.
• After the breakout of the trendline, there is no strong pullback - this means that the bears do not allow for a rebound.
• The lower shadow on the last candle indicates buyer reaction, but no confirmation yet.
👉 If 89,500 is broken, a move to 88,185 is very likely.
⸻
📉 4. MACD – negative signal
MACD shows:
• Bearish cross – the blue line crossed the orange line from above.
• The histogram turns into red bars - the downward momentum is increasing.
• MACD is below zero → confirmed downward trend in the 4-H interval.
👉 MACD confirms what we see on the chart: momentum is falling and a rebound is unlikely without consolidation.
Trade ideas

[SeoVereign] BITCOIN BULLISH Outlook – December 09, 2025As of December 9, I would like to share Bitcoin’s bullish scenario.
Below are the main factors supporting the current rebound.
- Detailed Technical Basis
1) Reaching the completion zone of the 1.902 DEEP CRAB pattern
In the Deep Crab pattern, the 1.618 or 1.902 levels are considered reversal zones,
and when the BC extension and XA ratio converge simultaneously, a strong retracement structure is formed.
This aligns with the typical pattern conditions in which the market attempts a meaningful rebound.
2) Overlap of key Fibonacci 0.618 ~ 0.886 retracement zones
The 0.618 ~ 0.886 levels, which serve as the basis for the mid-term trend, are currently overlapping near the price,
forming a strong buy-side defense zone.
This area has acted as a pivot for directional reversals multiple times in the past,
and it now carries sufficient probabilistic context for a similar reaction to occur again.
3) Detection of initial signals of market structure shift
Even as the price continues to decline, bearish momentum is slowing,
and a classic absorption pattern seen in oversold conditions is appearing in the volume structure.
This is not yet a confirmed reversal signal but can be interpreted as an early movement preparing for a rebound.
- Strategy and Target
Based on these factors, I have set the average target zone for this rebound at 92,450 USDT.
If upward movement unfolds, I will reassess whether to continue holding at that level.
I plan to gradually increase long positions based on the technical conditions described above.
Further updates to position management will follow depending on market movement and indicator changes.
Thank you for reading.

BTC Sell SetupBTC has swept the HTF 4H liquidity, i.e it has taken out the highs. ON 15 mint it has given a minor CHOCH indicating the reversal. ON 1H there is a clear RSI divergence as well, indicating this is just a extension move to grab liquidity. We are targeting 3:1 on the down side.

BTCUSDT.P – Bullish Reversal Targeting Key HighsPrice has swept the recent low near 89,934, triggering a sell-side liquidity grab and creating a Fair Value Gap (FVG) in the discount zone. This setup offers a high-probability long entry targeting the major swing highs from the previous structure.
• Direction: Long
• Entry Zone: 90,000 – 90,200 (Reaction within the FVG & mitigated sweep zone)
• Stop Loss: 89,600 (Below the swept low)
• Take Profit 1: 97,000 (Key previous high & major liquidity zone)
• Take Profit 2: 100,500 (Major swing high / equal legs expansion)
• Take Profit 3: 102,000 – 104,000 (HTF extension & liquidity target)
• R/R: Exceptional – Tight stop below sweep, aiming for significant higher-timeframe targets.
Key ICT/SMC Observations:
Liquidity Sweep Complete: Sell-side cleared below 89,934.
FVG & Order Block: Zone 90,000–90,200 provides premium entry.
Break of Structure: Awaiting move above 90,345 for confirmation.
Target Alignment: TP1 at 97,000 (previous high), TP2 at 100,500 (major swing), TP3 for full range expansion.
Bias is bullish while price holds above the swept low. Entry within the FVG targets a move back into the range, first toward 97,000, then 100,500+.

#BTC Rising Wedge📊#BTC Rising Wedge📉
🧠From a structural perspective, the daily chart correction is not yet over. Currently, it's within the blue resistance zone, so we still need to maintain a cautious approach.
➡️From a chart perspective, a rising wedge has gradually formed within the blue resistance zone. We generally use this model for corrections.
⚠️If we break through the blue resistance zone, it will turn into a support zone. Only then, with a suitable pullback, can we look for long trading opportunities.
🤜If you like my analysis, please like 💖 and share 💬
BITGET:BTCUSDT.P

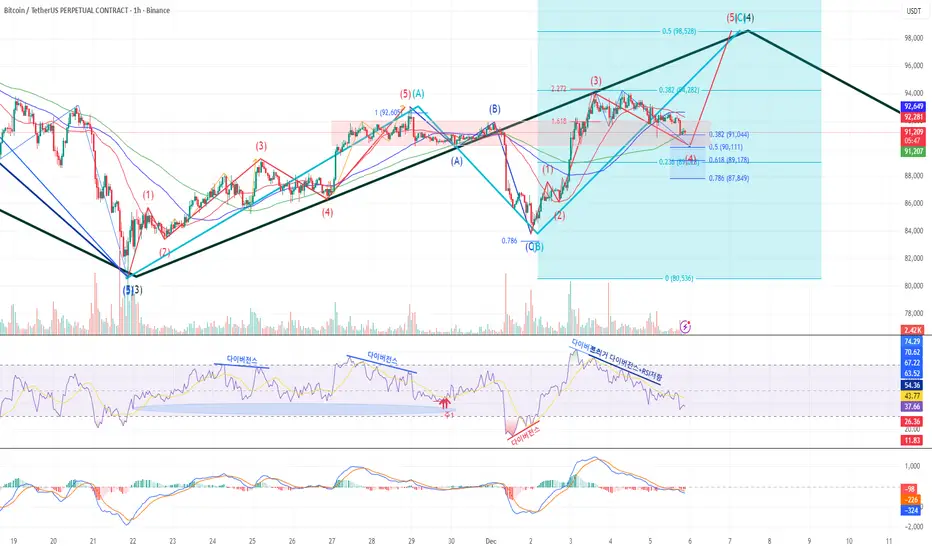
The larger Wave ④Bitcoin 1H Chart Analysis
Currently tracking a light blue ABC correction within the larger Wave ④.
Wave C is unfolding as a 5-wave structure; currently in Wave ④.
Adjusted the wave count this morning: what was initially labeled as Wave ① is now considered Wave ③, due to its extended size.
Wave ③ appears to have completed near the 2.272 Fibonacci extension.
A divergence formed, leading to the current Wave ④ pullback, which is finding support at a key supply-demand zone.
Watch for a MACD oscillator crossover — this could signal the start of Wave ⑤.
Focus on reactions at the support zone for trade decisions.
#BTC/USDT is currently strongly bullish#BTC
The price is moving in a descending channel on the 1-hour timeframe. It has reached the lower boundary and is heading towards breaking above it, with a retest of the upper boundary expected.
We have a downtrend on the RSI indicator, which has reached near the lower boundary, and an upward rebound is expected.
There is a key support zone in green at 92500. The price has bounced from this level multiple times and is expected to bounce again.
We have a trend towards consolidation above the 100-period moving average, as we are moving close to it, which supports the upward movement.
Entry price: 92990
First target: 93204
Second target: 93750
Third target: 94406
Don't forget a simple principle: money management.
Place your stop-loss below the support zone in green.
For any questions, please leave a comment.
Thank you.

BTC: Continue to Wait for an UptrendWe have been continuously signaling to go long on BTC, and all long orders placed below the 90K level have now started to generate profits. Next, we will continue to wait for a breakthrough above the 96K level to capture more profits.
I send out accurate signals every day to help you gain more profits. Don’t miss out!

#BTC Retests Resistance Zone📊#BTC Retests Resistance Zone⚠️
🧠As expected, the market found support near the short-term support level of 85358 and rebounded well. Currently, the price has retested the blue resistance zone. We should be wary of a potential pullback, so chasing the price higher here is not recommended. Instead, look for opportunities to short.
⚠️Note that if we successfully break through the blue resistance zone, we need to be cautious of a further surge.
🤜If you like my analysis, please like 💖 and share 💬
BITGET:BTCUSDT.P


BLACK SWAN322 and black swan
i cant tell more all in the chart. My last predict not in TV i predicted 10 october because i have signal from space)

BTC Trade Plan 06/12/2025Dear Traders,
appears to be a corrective bullish channel within a larger downtrend. This channel likely represents a pullback, increasing the probability of a downside continuation. The 94,500 – 98,500 zone is a major supply area that has acted as resistance multiple times and may trigger another rejection or fake breakout if retested. Should the price get rejected from this zone, the potential downside targets are 83,000, followed by 78,000 and 75,000. A bullish scenario becomes valid only if BTC closes a daily candle above 100,000, which could open the path toward the 105,000 – 110,000 resistance range. This is a market outlook and not financial advice — proper stop-loss and risk management are strongly recommended.
If this post helped you, consider boosting and sharing it. Thank you for the support.
Alireza!

Bitcoin 4H Update: Party's over... for now!Looks like BTC tried to break the top of its current channel (around $93.5k) but got firmly rejected by the :bear:
So, here’s the deal: Bitcoin needs to find its dancing shoes and make a big bounce from the immediate support line, which is hanging out around $92k. Let’s hope volume join the party.
If it can’t hold it, the next safety net is way down at the mid-range support around $89k

$BTC/USDT ANALYSISBitcoin is moving inside a symmetrical triangle on the 8-hour chart and the price is sitting near the middle of the range, trading below the 50MA which is acting as a resistance zone on top. Bulls are defending the lower trendline while sellers are active near the upper trendline, creating a squeeze where volatility is slowly reducing. If price holds above support, it may continue to move sideways inside the triangle, but a strong candle above the 50MA and triangle top would show strength, while a drop toward the ascending support would show weakness. Right now market is neutral and waiting for a clear break from this pattern, so upcoming moves around these trendlines will decide the next direction.

btc live tradeHello friends
Given the sharp upward movement we had, you can see that the sellers have made a high, which increases the possibility of a price correction, and we can witness a price increase in the price correction until the specified targets are reached.
This analysis is purely from a technical perspective and is not a buy or sell recommendation, so please observe risk and capital management.
*Trade safely with us*

BTC-USDTI directly said about Bitcoin that it’s going to correct and go down, and that’s exactly what happened 🕯🕯
But selling pressure caused it to even hit a shadow of 88. Right now, for Bitcoin to rise again, it needs to break 90k 🪙📊
If that happens, it can go up to 92,800 ✔️🔼
For now, Bitcoin’s support is at 88k 📣🚀

“BTC Wave Check — Which Hits First: 100K or 75K?"🌪️📉📈 BTC Daily Update — Caught Between 85K Support & 100K Dreams 🌊🏄♂️
BTC is still riding that heavy downtrend wave after slipping out of the rising channel, and even though we just got a bounce off the 85K support zone, it doesn’t feel like a power move — more like BTC catching a quick breath before deciding its next paddle 🏄♂️😮💨.
Right now price is still sitting under broken market structure, and the short-term rising wedge forming on the chart is a classic bearish continuation setup. Bulls are pushing… but the candles aren’t showing confidence. No strong follow-through, no dominant volume — just a soft climb that feels fragile 😬📉.
If this wedge breaks down, the map below looks like this:
80K minor support 🌫️
A small patch of demand, but nothing major.
75K major liquidity zone 💧🔥
This is the big one — clean demand, strong memory, and the level where the chart would love to refill orders if this correction keeps flowing.
And honestly? When you read the structure and the slope of momentum, that 75K zone feels like the place the market wants to check before any real trend shift.
But here’s the flip side — the bullish escape route:
If BTC somehow gets momentum back and reclaims 90K → 95K, then the road to 100K opens again. That range is the key door. Crack it, hold it, and BTC can ride a fresh wave toward six-figure territory 🚀💛.
Meanwhile, RSI is sitting right in mid-range — not overheated, not oversold. Basically telling us the market hasn’t made up its mind yet. Momentum is neutral, waiting for a spark.
So here’s the million-dollar surf question:
Which comes first — the legendary 100K breakout or a deep dive to the 75K demand pool?
🤔💭🌊📊🔥
Your call, surfers — where’s this wave heading next?
💬 What do you think about this scenario? Only share your idea if you’ve got another opinion — otherwise just hit that button 👍
#BTC #Bitcoin #Crypto #Trading #TechnicalAnalysis

05/12/2025 - BTC hail mary
I believe BTC could go up with the help of the new release, but that is just what I think.

BTCUSDT - Bearish ReversalBTCUSDT has formed a double top with divergence. Placing sell stop below neckline

BitcoinBitcoin has surpassed the $87,500 mark and has also broken through the key level of $90,000. As noted, the Inverse Head and Shoulders (IH&S) pattern has acted as a reversal signal. The market currently appears strong, as the price increase is supported by healthy trading volume. The next significant resistance level to watch for is $95,000, and it will be interesting to see how the price behaves at that point.
BTC: Target 100KBTC pulled back again over the weekend, dropping below 90K. I’ve been consistently emphasizing that levels below 90K present the optimal buying opportunity—and the market has rallied as predicted, aligning perfectly with my analysis. We now continue to wait for an upward breakout, with the target set at 100K.
I send accurate signals daily—all signals have been 100% correct for two consecutive weeks. Don’t miss out!

BTC aiming to retest 98k to 100k Several factors coming together:
The market is very bearish in sentiment. Selling likely exhausted here and short side probably overcrowded
Daily demand is holding and displaying strong reactions
Untested Weekly gap above and untested daily supply zone are calling for a liquidity test.

BTC_updateHidden Bullish divergence on the weekly chart. Still stuck in the cloud. When we break trough the cloud next resistance zones are indicated on the chart. Biggest ressistance zone is the 109.000$ region. I will do an update next saturday.
