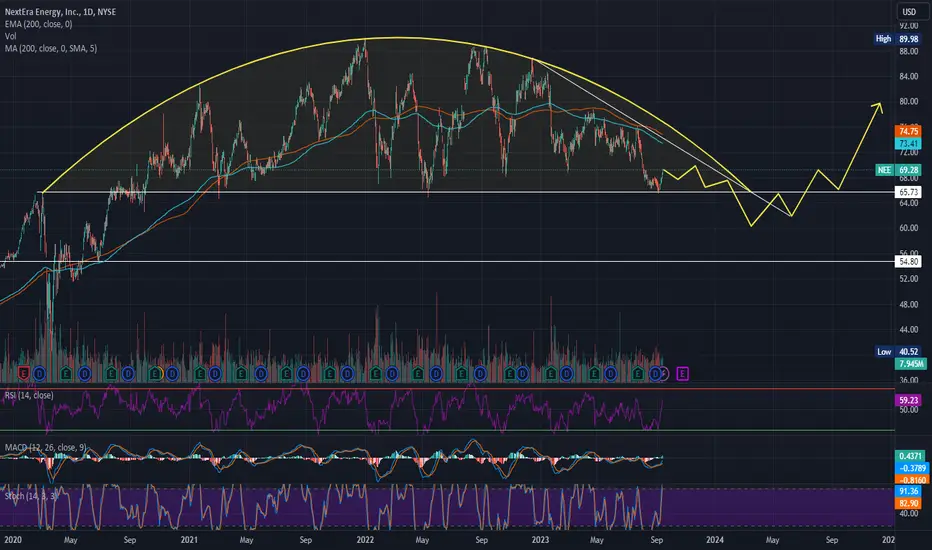
NEEContinuation of an idea.
The company belongs to the "defensive" sector of utilities, which is resilient to a slowing economy.
With the Fed set to begin easing the MPC, I believe the backdrop will become more favorable.
tp1 61
tp2 69
3.62USD
7.31 BUSD
22.81 BUSD
2.04 B
About NEXTERA ENERGY INC
Sector
Industry
CEO
John W. Ketchum
Website
Headquarters
Juno Beach
Employees (FY)
16.8 K
Founded
1925
ISIN
US65339F1012
FIGI
BBG00YFGCVS1
NextEra Energy, Inc. engages in the provision of renewable energy. It operates through the following segments: FPL and NEER. The FPL segment involves the generation, transmission, distribution, and sale of electric energy in Florida. The NEER segment produces electricity from clean and renewable sources, including wind and solar. The company was founded on December 28, 1925 and is headquartered in Juno Beach, FL.

NEE NEE NEE BUY BUY BUYHoping to see consolidation around current levels, looking to 2x in the next 2-3yrs.
NEXTERA NOT STOPPING

NEE - Increased probability loss of valueInterpretation:
Previously disorganized Fibo clouds have gradually aligned themselves generating resistance against the evolution of the candles. The compacting of fibo clouds from different timeframes signals direction and strength towards the first target to be reached
Reaching the first target m

If 48$ is broken out, next target is 30$Energy stocks will shine even more than they have done it at the present, but more work must be done.
Therefore, I expect a retest to 48$.
My target is that we could see 30 or even 25$ once 48$ is taken out.
To sum up: Watching at 48$. If it doesn´t hold I will start buying at 30$

NEE Round Top. Look Out Below (for now).Re-posting recent idea on NEE. Short-term troubles from round-top could put NEE in the $60s for a while ($55 support). Great long-term investment after that as we get back to the 40-year trend.
NextEra Energy Surges
NextEra Energy ( NYSE:NEE ), the leading renewable energy generator in the United States, has reported a fourth-quarter profit that surpassed Wall Street expectations. The company's impressive performance is attributed to the decline in natural gas prices, boosting its regulated utilities business.

NEEAgainst the background of strong growth of UST yields, the protective assets with low beta and high dividend yields were under strong pressure. Usually at such a strong separation of this sector from the average there is a rapid recovery. The yield of UST stabilized the recovery started.
tp1 67
tp2

NEE Target $93NEE completed long term correction and showing signs of reversal.
Fundamentals seem good.
Expecting it to reach previous highs.
Target $93

More Downside in NextEra?NextEra Energy fell sharply in late September as higher interest rates impacted the value of its wind and solar farms. Now after a bounce, momentum bears may look for a retest of recent lows.
The first pattern on today’s chart is the selloff that began on September 27 after its NextEra Energy Partn

Fell From a TriangleDeep fall from a triangle pattern.
Appears to have hit close to the 1.618 and is trying to recover.
If this is far as it falls, this M could be called a Crab. Some would wait for 2 positive closes.
The M is better seen on weekly.
No recommendation

See all ideas
Trade directly on the supercharts through our supported, fully-verified and user-reviewed brokers.


Curated watchlists where NEE is featured.

Frequently Asked Questions
The current price of NEE is 62.15 USD — it has decreased by 0.08% in the past 24 hours.
Depending on the exchange, the stock ticker may vary. For instance, on BVL exchange NEXTERA ENERGY INC stocks are traded under the ticker NEE.
NEXTERA ENERGY INC is going to release the next earnings report on Apr 23, 2024. Keep track of upcoming events with our Earnings Calendar.
NEE stock is 0.08% volatile and has beta coefficient of 0.40. Check out the list of the most volatile stocks — is NEXTERA ENERGY INC there?
One year price forecast for NEXTERA ENERGY INC has a max estimate of 84.00 USD and a min estimate of 44.00 USD.
NEE earnings for the last quarter are 0.94 USD per share, whereas the estimation was 0.88 USD resulting in a 6.63% surprise. The estimated earnings for the next quarter are 0.49 USD per share. See more details about NEXTERA ENERGY INC earnings.
NEXTERA ENERGY INC revenue for the last quarter amounts to 7.17 B USD despite the estimated figure of 7.07 B USD. In the next quarter revenue is expected to reach 5.72 B USD.
Yes, you can track NEXTERA ENERGY INC financials in yearly and quarterly reports right on TradingView.
NEE net income for the last quarter is 1.21 B USD, while the quarter before that showed 1.22 B USD of net income which accounts for −0.74% change. Track more NEXTERA ENERGY INC financial stats to get the full picture.
Today NEXTERA ENERGY INC has the market capitalization of 131.38 B, it has increased by 4.16% over the last week.
Yes, NEE dividends are paid quarterly. The last dividend per share was 0.51 USD. As of today, Dividend Yield (TTM)% is 3.00%. Tracking NEXTERA ENERGY INC dividends might help you take more informed decisions.
NEXTERA ENERGY INC dividend yield was 3.08% in 2023, and payout ratio reached 51.95%. The year before the numbers were 2.03% and 81.11% correspondingly. See high-dividend stocks and find more opportunities for your portfolio.
Like other stocks, NEE shares are traded on stock exchanges, e.g. Nasdaq, Nyse, Euronext, and the easiest way to buy them is through an online stock broker. To do this, you need to open an account and follow a broker's procedures, then start trading. You can trade NEXTERA ENERGY INC stock right from TradingView charts — choose your broker and connect to your account.
As of Apr 19, 2024, the company has 16.80 K employees. See our rating of the largest employees — is NEXTERA ENERGY INC on this list?
Investing in stocks requires a comprehensive research: you should carefully study all the available data, e.g. company's financials, related news, and its technical analysis. So NEXTERA ENERGY INC technincal analysis shows the sell today, and its 1 week rating is sell. Since market conditions are prone to changes, it's worth looking a bit further into the future — according to the 1 month rating NEXTERA ENERGY INC stock shows the sell signal. See more of NEXTERA ENERGY INC technicals for a more comprehensive analysis.
If you're still not sure, try looking for inspiration in our curated watchlists.
If you're still not sure, try looking for inspiration in our curated watchlists.
We've gathered analysts' opinions on NEXTERA ENERGY INC future price: according to them, NEE price has a max estimate of 84.00 USD and a min estimate of 44.00 USD. Read a more detailed NEXTERA ENERGY INC forecast: see what analysts think of NEXTERA ENERGY INC and suggest that you do with its stocks.
EBITDA measures a company's operating performance, its growth signifies an improvement in the efficiency of a company. NEXTERA ENERGY INC EBITDA is 10.68 B USD, and current EBITDA margin is 46.81%. See more stats in NEXTERA ENERGY INC financial statements.