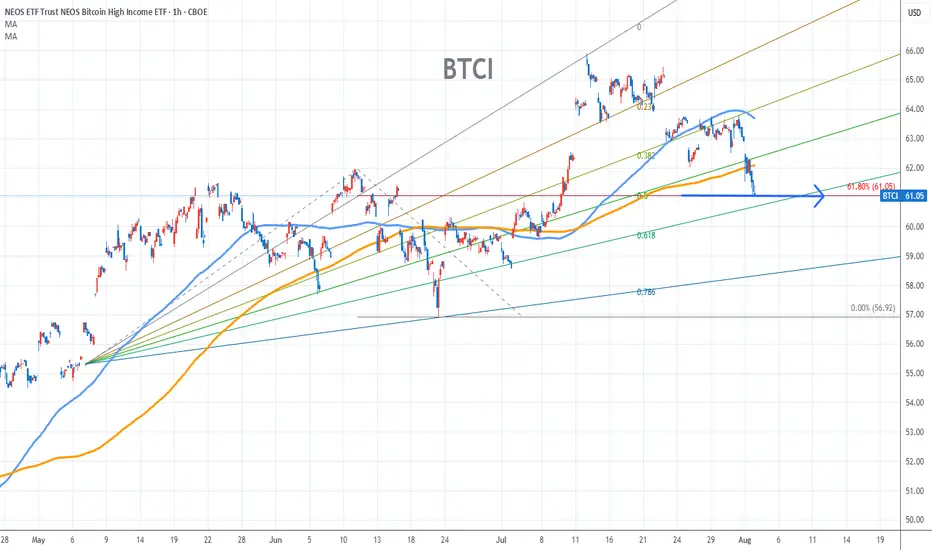
BTCI Chart Fibonacci Analysis 080325Trading Idea
1) Find a FIBO slingshot
2) Check FIBO 61.80% level
3) Entry Point 61/61.80%
Chart time frame:B
A) 15 min(1W-3M)
B) 1 hr(3M-6M)
C) 4 hr(6M-1year)
D) 1 day(1-3years)
Stock progress:C
A) Keep rising over 61.80% resistance
B) 61.80% resistance
C) 61.80% support
D) Hit the bottom
E) Hit the top
Stocks rise as they rise from support and fall from resistance. Our goal is to find a low support point and enter. It can be referred to as buying at the pullback point. The pullback point
In-depth trading ideas
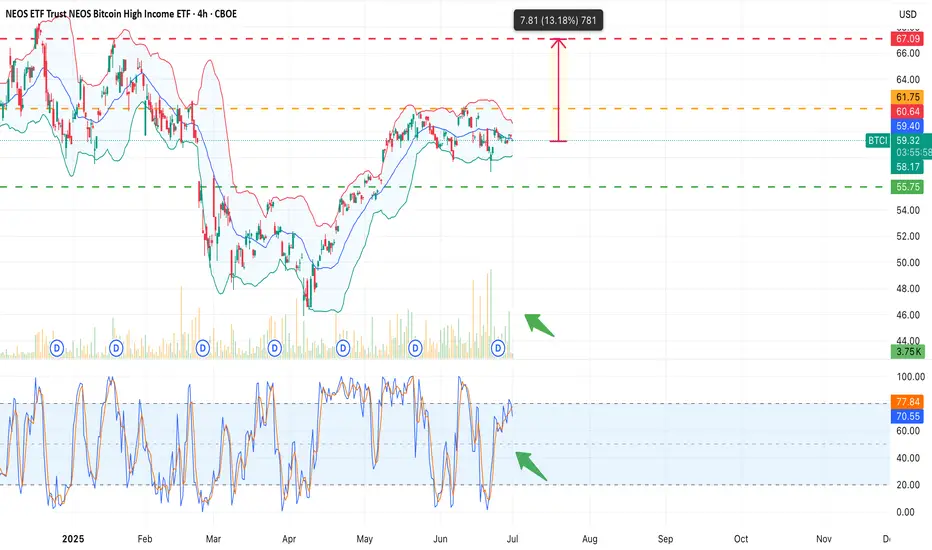
BTCI – setting up for a breakout?What is CBOE:BTCI ?
BTCI is the NEOS Bitcoin High Income ETF – a covered-call ETF designed to provide exposure to Bitcoin price trends with monthly income. The fund uses options strategies to generate consistent yields while holding Bitcoin futures and related instruments.
💰 Annual dividend yield: approx. 18%, paid monthly
📆 Ideal for income-focused investors who still want crypto exposure without direct volatility.
CBOE:BTCI Current price: $59.64
Strong volume is building up (green arrow)