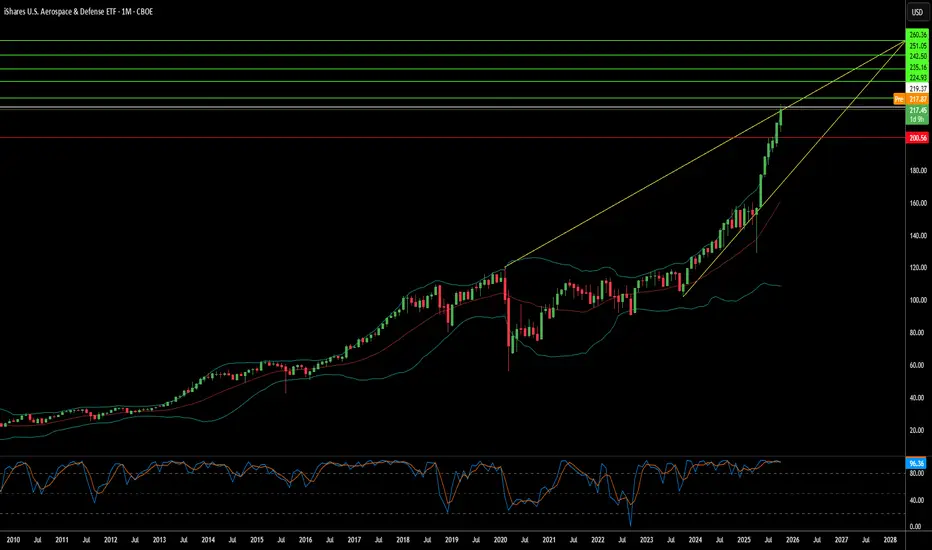
Oct till JanNot financial advice. This is how I read Martin Armstrong’s Socrates arrays and reversals for my own trading, and trading carries real risk of loss. The arrays come from screenshots taken Oct 9, 2026, and they update as each session closes... check them again before you act on any of this. The Pine
Compare with iShares U.S. Aerospace & Defense ETF
Key stats
Fund info
Home page
Inception date
May 1, 2006
Structure
Open-Ended Fund
Replication method
Physical
Dividend treatment
Distributes
Distribution tax treatment
Qualified dividends
Income tax type
Capital Gains
Max ST capital gains rate
39.60%
Max LT capital gains rate
20.00%
Primary advisor
BlackRock Fund Advisors
Distributor
BlackRock Investments LLC
ISIN
US4642887602
CUSIP
464288760
FIGI
BBG000PB38X0
Identifiers
ISIN US4642887602
ITA tracks a market-cap-weighted index of US-listed manufacturers, assemblers and distributors of aircraft and aircraft parts primarily used in commercial or private air transport and producers of components and equipment for the defense industry, including military aircraft, radar equipment and weapons. The fund caps its holdings to meet diversification requirements, limiting a single company to 22.5% of the funds assets, and preventing completely unbiased exposure to the top few that dominate the industry. Concentration risk remains high despite the caps, reflecting the undiversified nature of the industry. Despite this, ITA still allocates holdings to a mixture of large, mid, and small-cap companies. The fund uses a representative sampling strategy instead of replicating the underlying index. The index is rebalanced quarterly.
Classification
What's in the fund
Exposure type
Electronic Technology
Breakdown by region
Top 10 holdings
Market Physics Beyond Moving Averages: The Kinematic FrameworkMarket Physics Beyond Moving Averages: The Kinematic & Hilbert Space Framework
For decades, traditional technical analysis has relied on static chart patterns or lagging moving averages. While these tools attempt to define where an asset has been, they fail to measure the live physical forces driv
ITA - 150 SMA Method and Cup & Handle Setup💡 Swing setup idea
Longer-term breakout setup / 150 SMA method
🔎 Analysis summary:
The aerospace & defense ETF touched the 150 SMA and moved higher from there. We can also see a big cup and handle closing, which puts this longer-term setup in an interesting spot.
👀 Levels to watch:
Entry tri
ITA : iShares U.S. Aerospace & Defense ETF IdeaThe defense sector has been in a steady structural advance for years, and price is now resting inside a zone of interest formed at the highs. Above it, three institutional areas sit stacked like floors of a building that has not been visited yet. Below, two support zones wait in silence, one shallow
ITA | May, 2026 | Continued stock growth- Timeframe: Weekly
- Trade type: Buy stop order
- Price: 227.26
- Take Profit: Open
- Stop Loss: 216.68 (-4.70 %)
Idea: Long on a breakout above last week's high — bullish momentum continuation.
Entry: Buy stop above last week’s high.
Stop-loss: Below the low of the same candle.
If the weekly cand
Investing in Shield and Sword: ITA ETF AnalysisThe iShares US Aerospace & Defense ETF (ITA) remains a cornerstone for tactical investors. It provides concentrated exposure to the titans of American military might. Global instability and rapid technological shifts now dictate its market trajectory. This analysis explores the multifaceted drivers
Did $ITA and Defence Companies give us a heads-up on Friday?Oil companies and defence companies were getting giddy in the pre-market - thanks to the US Delta Force actions at the weekend in Venezuela.
However I had noticed on Friday afternoon that CBOE:ITA and AMEX:PPA had already started pumping on Friday afternoon. Was someone aware of what was comin
"God forbid let peace breakout." Look at US Defence Stocks $ITALeo Tolstoy included that line in his novel "War & Peace". It might be said that many holders of defence stocks will be uttering the same should this weeks negotiations over the conflict of Ukraine make progress.
It might be said that the price action already denotes the trajectory of the peace tal
Can Instability Be an Asset Class?Aerospace and Defense (A&D) ETFs have shown remarkable performance in 2025, with funds like XAR achieving a 49.11% year-to-date return. This surge follows President Trump's October 2025 directive to resume U.S. nuclear weapons testing after a 33-year moratorium, a decisive policy shift responding to
See all ideas
Summarizing what the indicators are suggesting.
Oscillators
Neutral
Oscillators
Neutral
Summary
Neutral
Summary
Neutral
Summary
Neutral
Moving Averages
Neutral
Moving Averages
Neutral
Displays a symbol's price movements over previous years to identify recurring trends.
Frequently asked questions
An exchange-traded fund (ETF) is a collection of assets (stocks, bonds, commodities, etc.) that track an underlying index and can be bought on an exchange like individual stocks.
ITA trades at 209.07 USD today, its price has risen 1.38% in the past 24 hours. Track more dynamics on ITA price chart.
ITA net asset value is 209.13 today — it's fallen 2.84% over the past month. NAV represents the total value of the fund's assets less liabilities and serves as a gauge of the fund's performance.
ITA assets under management is 11.80 B USD. AUM is an important metric as it reflects the fund's size and can serve as a gauge of how successful the fund is in attracting investors, which, in its turn, can influence decision-making.
ITA price has fallen by −2.50% over the last month, and its yearly performance shows a 0.41% increase. See more dynamics on ITA price chart.
NAV returns, another gauge of an ETF dynamics, have risen by −2.84% over the last month, have fallen by −2.84% over the last month, showed a −9.36% decrease in three-month performance and has increased by 1.66% in a year.
ITA fund flows account for 120.46 M USD (1 year). Many traders use this metric to get insight into investors' sentiment and evaluate whether it's time to buy or sell the fund.
Since ETFs work like an individual stock, they can be bought and sold on exchanges (e.g. NASDAQ, NYSE, EURONEXT). As it happens with stocks, you need to select a brokerage to access trading. Explore our list of available brokers to find the one to help execute your strategies. Don't forget to do your research before getting to trading. Explore ETFs metrics in our ETF screener to find a reliable opportunity.
ITA invests in stocks. See more details in our Profile section.
ITA expense ratio is 0.37%. It's an important metric for helping traders understand the fund's operating costs relative to assets and how expensive it would be to hold the fund.
No, ITA isn't leveraged, meaning it doesn't use borrowings or financial derivatives to magnify the performance of the underlying assets or index it follows.
In some ways, ETFs are safe investments, but in a broader sense, they're not safer than any other asset, so it's crucial to analyze a fund before investing. But if your research gives a vague answer, you can always refer to technical analysis.
Today, ITA technical analysis shows the neutral rating and its 1-week rating is neutral. Since market conditions are prone to changes, it's worth looking a bit further into the future — according to the 1-month rating ITA shows the neutral signal. See more of ITA technicals for a more comprehensive analysis.
Yes, ITA pays dividends to its holders with the dividend yield of 0.27%.
ITA trades at a premium (0.03%).
Premium/discount to NAV expresses the difference between the ETF’s price and its NAV value. A positive percentage indicates a premium, meaning the ETF trades at a higher price than the calculated NAV. Conversely, a negative percentage indicates a discount, suggesting the ETF trades at a lower price than NAV.
ITA shares are issued by BlackRock, Inc.
ITA follows the DJ US Select / Aerospace & Defense. ETFs usually track some benchmark seeking to replicate its performance and guide asset selection and objectives.
The fund started trading on May 1, 2006.
The fund's management style is passive, meaning it's aiming to replicate the performance of the underlying index by holding assets in the same proportions as the index. The goal is to match the index's returns.