CETUS/USD – 1H Technical AnalysisThe M formation appears as a correction pattern within the current downtrend.
If confirmed, CETUS may rebound from the lower trend channel and start a parabolic uptrend.
🔹 Price is currently between the 50 & 200 SMA — a potential bullish crossover may trigger soon.
🔹 Bullish RSI divergence supports upward momentum.
🔹 Target zone: $0.75 💥
🔹 Key support to hold: 0.045 level
If the M pattern plays out, CETUS could enter a strong parabolic uptrend phase.
In-depth trading ideas
CETUS/USD Technical Analysis Aims to 0,7$ on Alt Season🇬🇧 English Explanation:
📉 CETUS is undergoing a significant correction. Based on Elliott Wave Theory:
🔢 Wave structure: (1)-(2)-(3)-(4)-(5) appears complete.
🔁 Followed by corrective waves (A)-(B)-(C) in play.
🔵 The blue box below wave (C) marks a potential target or reaction zone.
📏 Fibonacci retracement levels drawn from the top of wave (5) to the bottom of wave (C):
These levels are critical for bounce or reversal potential.
💥 The yellow horizontal zone may represent a support or liquid
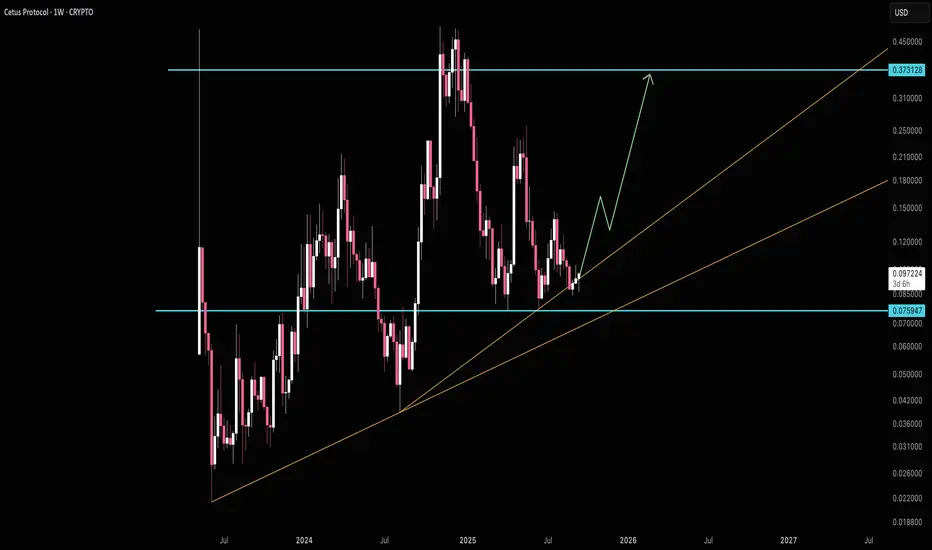
An interesting setup for Small Risk/Big RewardCetus is looking very interesting to me. I took a position here hoping for big upside. If you're not aware Cetus is a DEX on Sui network. The CETUS token can be staked and yeilds a return of the DEX fees. That upper 0.373 area has been resistance a few times now and I'm speculating it'll target that area once again.
Good luck!