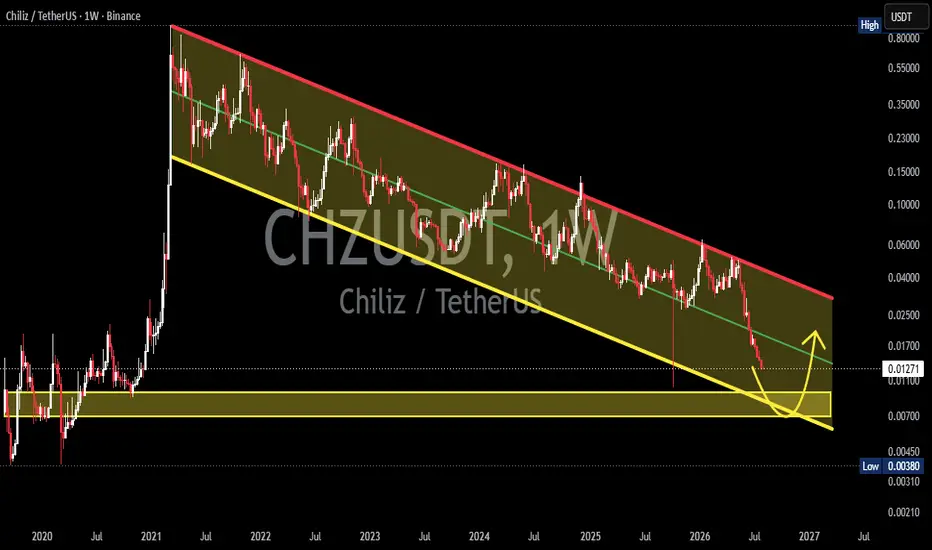
CHZ: A Major Structural Shift Could Be DevelopingCHZ has spent years trending lower inside a broad descending channel, but price is now reacting strongly from a major long-term base zone around $0.010–$0.014.
The current recovery is constructive, but the real test sits ahead. The $0.04938 key resistance aligns closely with the broader descending
Compare with CHZ/USDT
Very IMPORTANT $CHZ Chart, We Confirmed BREAKOUTThis Adam and Eve pattern is very accurate, we have broken from above of its resistance, so what we are expecting here, is further continuation to the upside.
We are currently overall bullish on the market, and our analysis has been very accurate, if you check out our trading-view history, you'll s
$CHZ: Trade plan LongBYBIT:CHZUSDT.P
Market sentiment is bullish. Upside breakout from resistance is very likely.
Quick trade setup.
Entry on a pullback to weekly support 📊W-Levels. Reduced position size — trading right at monthly resistance.
🧩IMA data: 🐋large players are holding long positions, US session was adding.
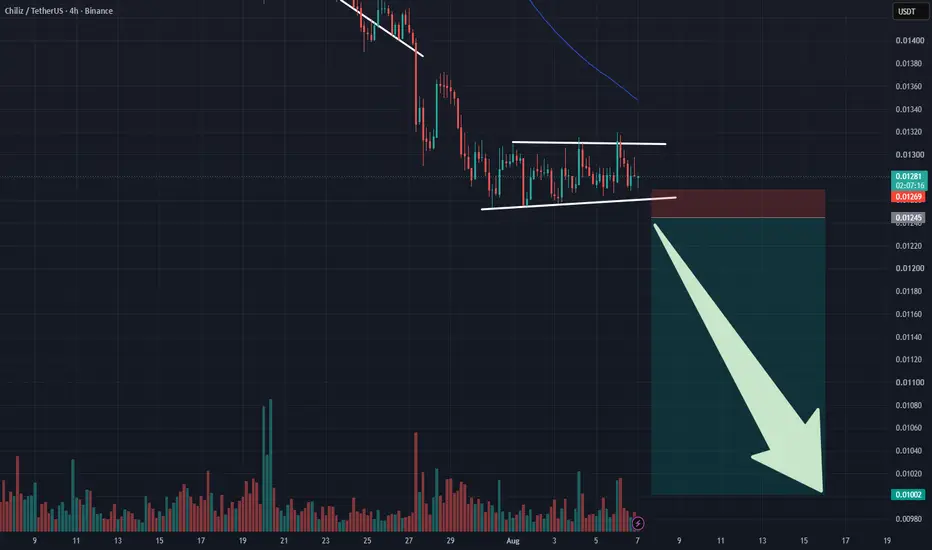
Currenlty only IDEA is short in CHZUSDTWe are currently seeing that in pair has been declining the higher prices consolodation zone . probability it breaks down POC and go to lower is high due to seller were increasing momentum in previous impulses . only at the bottom we get absorption of sellers we look for longs . if they build liquid
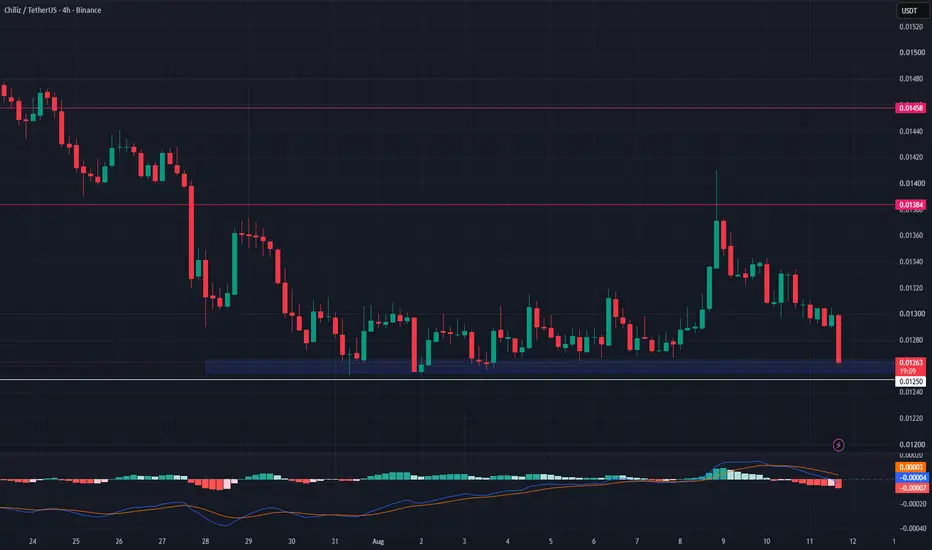
CHZ Bullish Rebound Setup From Key SupportChiliz (CHZ) has showing a strong bullish reaction near $0.01253 support.
As long as the $0.01265–$0.01255 zone holds, price could continue recovering toward $0.01382 and $0.01458.
Trade Levels:
Entry: $0.01265–$0.01255
TP1: $0.01382
TP2: $0.01458
SL: $0.01250
Bias remains bullish while support
CHZ: Consolidation Beneath MA100 ResistanceCHZ: Consolidation Beneath MA100 Resistance – Dual Strategic Short Execution Framework
Chiliz (CHZ) continues to reinforce its primary downward trajectory following several consecutive weeks of persistent suppression beneath the dynamic MA100 trendline. Over the past 8 days, the price action has e
CHZUSDT - Descending Channel, Breakdown or Reversal?📊 Technical Analysis
💰 Coin: GETTEX:CHZ #CHZ
⏳ Time Frame: 1W
📉 Pattern: Descending Channel (Long-Term)
🎯 Bias: Waiting for confirmation at the major support zone.
---
🟡 Pattern Overview
CHZ has been moving inside a Descending Channel since its 2021 peak. This pattern consists of:
🔴 Upper
See all ideas
Summarizing what the indicators are suggesting.
Oscillators
Neutral
Oscillators
Neutral
Summary
Neutral
Summary
Neutral
Summary
Neutral
Moving Averages
Neutral
Moving Averages
Neutral
Displays a symbol's price movements over previous years to identify recurring trends.
Frequently asked questions
The current price of CHZUSDT SPOT (CHZ) is 0.01492 USDT — it has fallen −1.27% in the past 24 hours. Try placing this info into the context by checking out what coins are also gaining and losing at the moment and seeing CHZ price chart.
CHZUSDT SPOT price has fallen by −4.49% over the last week, its month performance shows a 9.51% increase, and as for the last year, CHZUSDT SPOT has decreased by −64.22%. See more dynamics on CHZ price chart.
Keep track of coins' changes with our Crypto Coins Heatmap.
CHZUSDT SPOT (CHZ) reached its highest price on Mar 30, 2022 — it amounted to 0.33088 USDT. Find more insights on the CHZ price chart.
See the list of crypto gainers and choose what best fits your strategy.
CHZUSDT SPOT (CHZ) reached the lowest price of 0.01166 USDT on Aug 18, 2026. View more CHZUSDT SPOT dynamics on the price chart.
See the list of crypto losers to find unexpected opportunities.
The safest choice when buying CHZ is to go to a well-known crypto exchange. Some of the popular names are Binance, Coinbase, Kraken. But you'll have to find a reliable broker and create an account first. You can trade CHZ right from TradingView charts — just choose a broker and connect to your account.
Crypto markets are famous for their volatility, so one should study all the available stats before adding crypto assets to their portfolio. Very often it's technical analysis that comes in handy. We prepared technical ratings for CHZUSDT SPOT (CHZ): today its technical analysis shows the sell signal, and according to the 1 week rating CHZ shows the sell signal. And you'd better dig deeper and study 1 month rating too — it's sell. Find inspiration in CHZUSDT SPOT trading ideas and keep track of what's moving crypto markets with our crypto news feed.
CHZUSDT SPOT (CHZ) is just as reliable as any other crypto asset — this corner of the world market is highly volatile. Today, for instance, CHZUSDT SPOT is estimated as 9.61% volatile. The only thing it means is that you must prepare and examine all available information before making a decision.
You can discuss CHZUSDT SPOT (CHZ) with other users in our public chats, Minds or in the comments to Ideas.