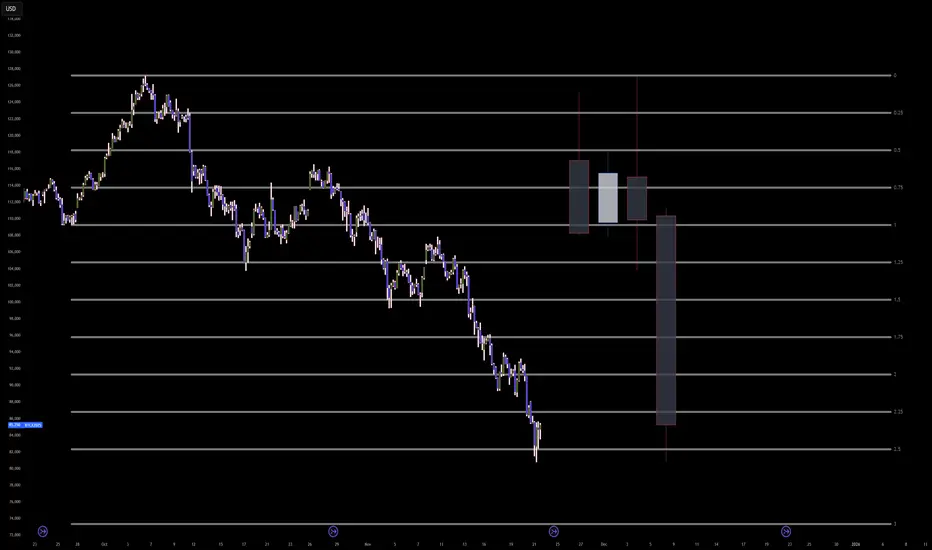
Long Reversal Trade off SupportPrice has rebounded from a major support zone around $80,860 and is pushing back above the minor level near $91,970. The trade setup goes long, aiming for a move toward the next significant resistance at $101,100. The stop is positioned below the recent swing low, capturing a potential trend reversa
Related futures

$BTCLooking at this BTC/USD (Bitcoin futures) daily chart, we see price action that screams caution for bulls. Bitcoin has been grinding higher in a choppy uptrend since late October, but it's now testing a critical resistance cluster around $98,000–$100,000. Volume is tapering off on the upside, sugges

Bitcoin Corrected, What’s Next?Back in July, I did a tutorial identifying the 120,000 level as a potential peak for Bitcoin, with the possibility of an open correction. Bitcoin subsequently formed a double top before pulling back to its recent low.
In my view, Bitcoin should continue to trend along this parallel channel.
We wil

Two great trades that would be good for beginners11 28 25 the exchanges are having some problems and some of the exchanges are at least temporarily closed so be aware. A few weeks ago I asked Bobby to find me some easier trades to take because he's starting to trade and he's not going to be able to trade the large contract on gold or silver he has

Bitcoin at the Edge – What Comes Next?Over the past couple of months, Bitcoin has been navigating a complex mix of macro shifts, liquidity changes, and sector-specific catalysts that, in our opinion, have pushed the market into a critical decision zone. Sentiment has become increasingly divided: long-term structural bulls remain confide

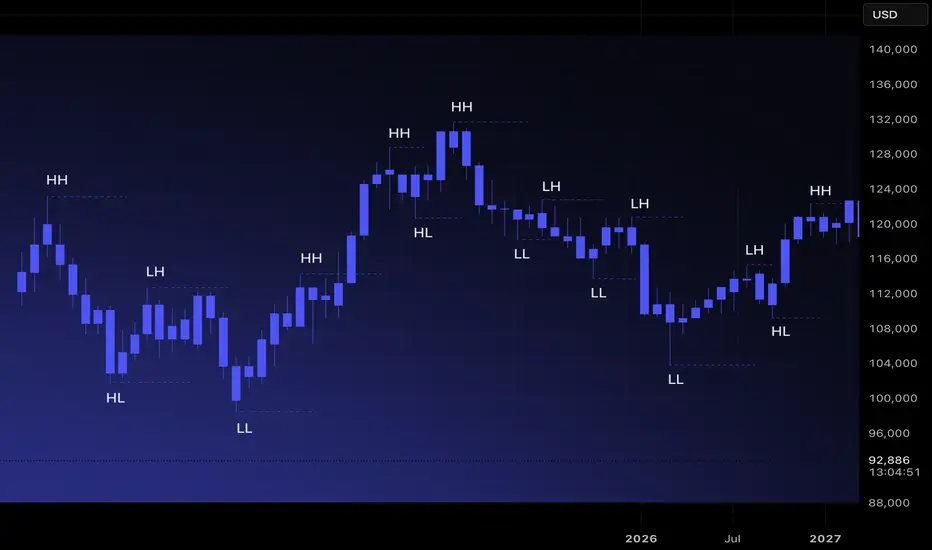
Market Structure 101: Navigating Price ActionMost traders jump directly into indicators, oscillators, or patterns. Yet every chart has a deeper foundation that determines direction long before any tool is applied. Market structure is that foundation. When you understand how price forms highs, lows, and transitions between them, you stop reacti
BTC CME Futures: The Capitulation Buy SetupSimply:
The logic here is simple.
Bitcoin has dropped too far and too fast.
We are currently hitting a major mathematical exhaustion point (the 2.5 Standard Deviation line).
At the same time, we are entering that big blue support box between 78k and 82k where the massive rally started earlier th
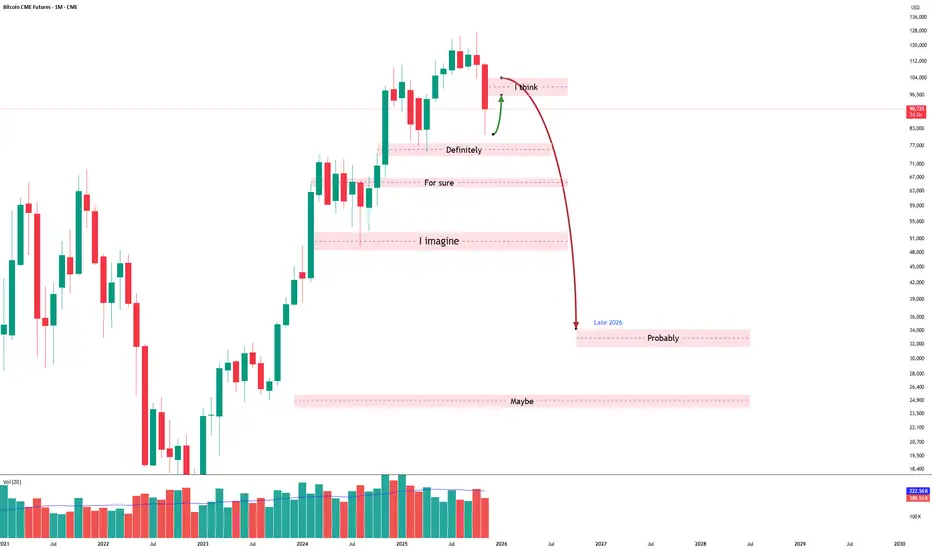
The fall of Bitcoin?Chart is self explanatory. Major downtrend preceded by a short rally to the high 90's, low 100s.
Bottom around 30... maybe if we are lucky 25k.
God speed and good luck.
Bitcoin Futures Approach Crucial Triangle Structure Bitcoin CME futures are forming a technical pattern that points to a period of consolidation before a potential upward surge, provided that key support levels remain intact.
Recent price action indicates the development of a Wave 4 triangle, a structure that often appears when markets pause before
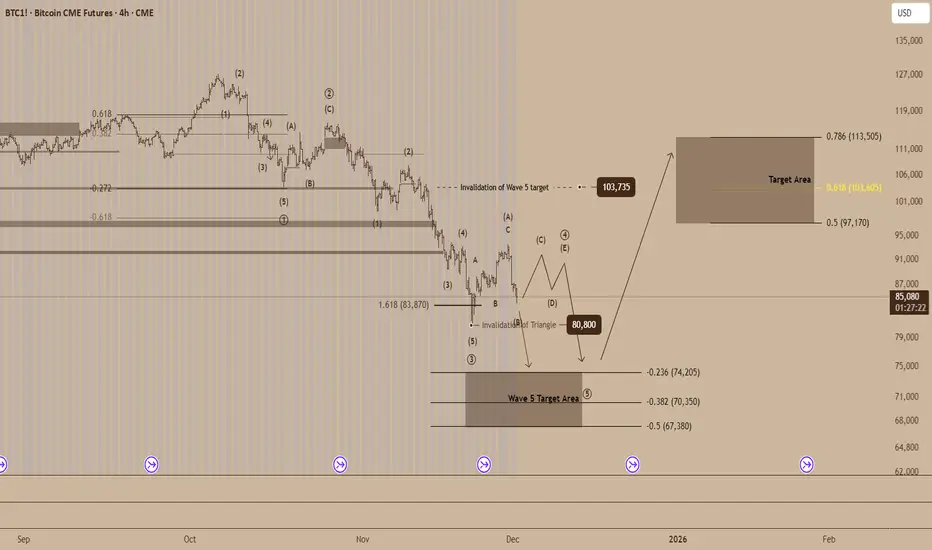
Bitcoin CME Futures – Key Support Test With a Long-Term Target aBitcoin CME Futures has broken below several Fibonacci levels and is currently reacting inside a major demand zone between 88,000 – 82,000. This area represents the last strong bullish defense before a deeper correction.
The sell-off shows strong bearish momentum, but the long lower wick indicates

See all ideas
Displays a symbol's price movements over previous years to identify recurring trends.