Eth's CME Gaps: Don't bet against themThis chart plots all of Eth's CME gaps historically (filled and unfulfilled), and calculates the probability of a gap being filled across various time frames (see the chart on the top-right). Currently unfilled gaps are plotted as thick-dotted lines continuing up to the current time. Filled gaps are
Related futures

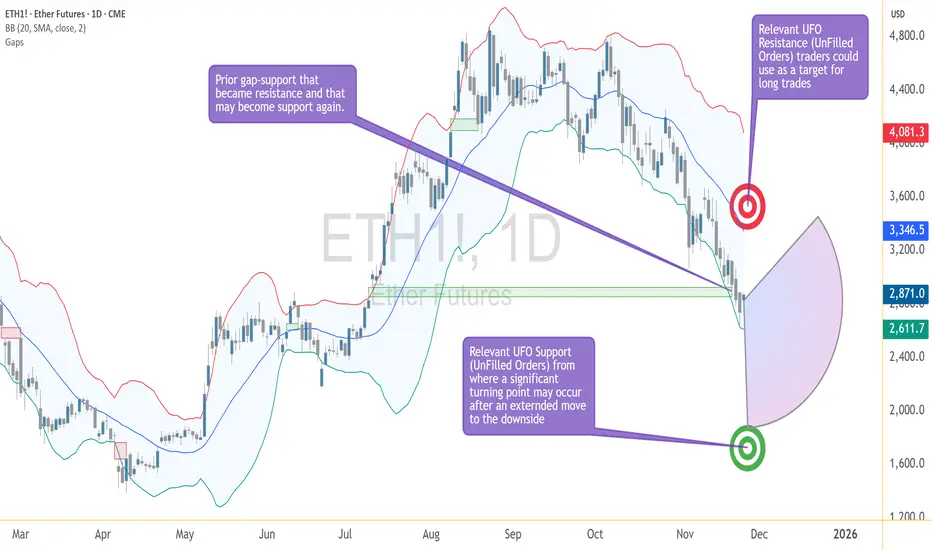
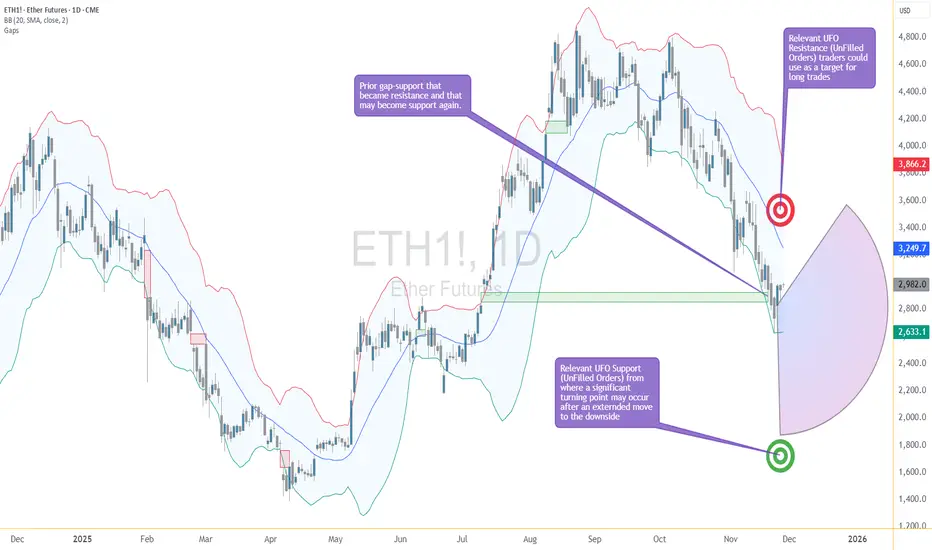
Crypto Walking the Edge: Will the Band Snap or Stretch Lower?Ether Futures (ETH) continue to tell a story of controlled pressure — one that traders have seen before across many markets, but rarely with this level of composure. The selling has been persistent, yet measured, and despite the depth of the decline, Ether has remained remarkably disciplined within
Ether Breaks the Ceiling: Is This the First Real Clue of a Turn?Ether Futures just pulled an interesting move — it finally pushed above the upper edge of the stubborn gap that has been capping price below 2853.5.
For a while, ETH was sliding down the lower Bollinger Band like a chilled skier who forgot how to turn. Now? It just jumped over the fence.
This chan
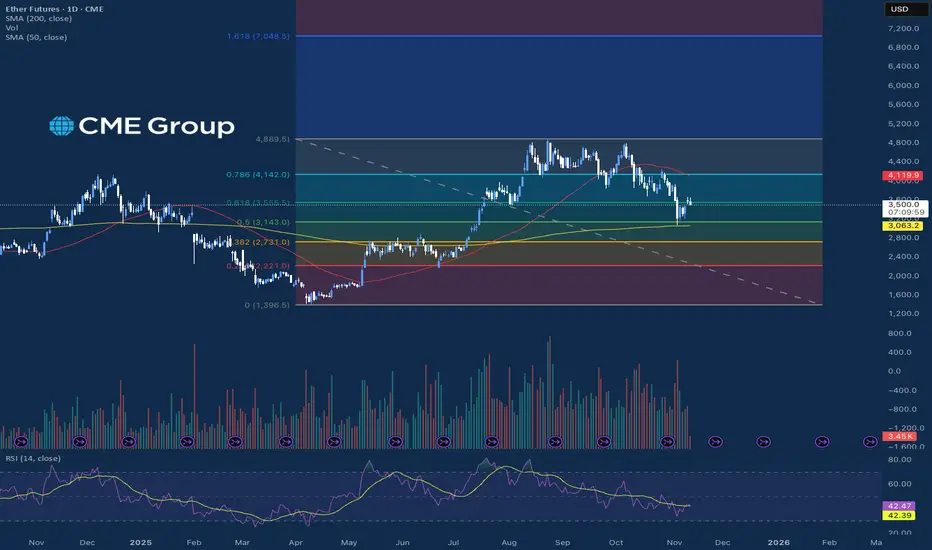
ETH1!GAP AND 0.61 FIBBO INTERESTING POINT REMEMBER GAP CLOSE ALWAYS gap´always close all chart is similar . review by backtesting.

Price moves in a very specific way...In this short video I go through a bit of lower timeframe price action on the ETH futures chart.
Yeah, it is pretty straight forward and is just another example of price moving in terms of liquidity, efficiency, and fair value on a fractal nature.
R2F Trading

Ether Futures On The MoveEther futures experienced a highly volatile start to November, characterized by a sharp mid-month sell-off that erased strong gains made in late October. After peaking above the $4,700 level, the price quickly reversed, plunging toward 3,800 as global market risk sentiment deteriorated following cau
SP500, Euro, GOLD & Ether H1 - Daily Trade SetupsIn this update we review the recent price action in the SP500, Euro, Ether & Gold futures markets and identify the next high-probability trading opportunities and price objectives to target. To review today's video analysis, click here!

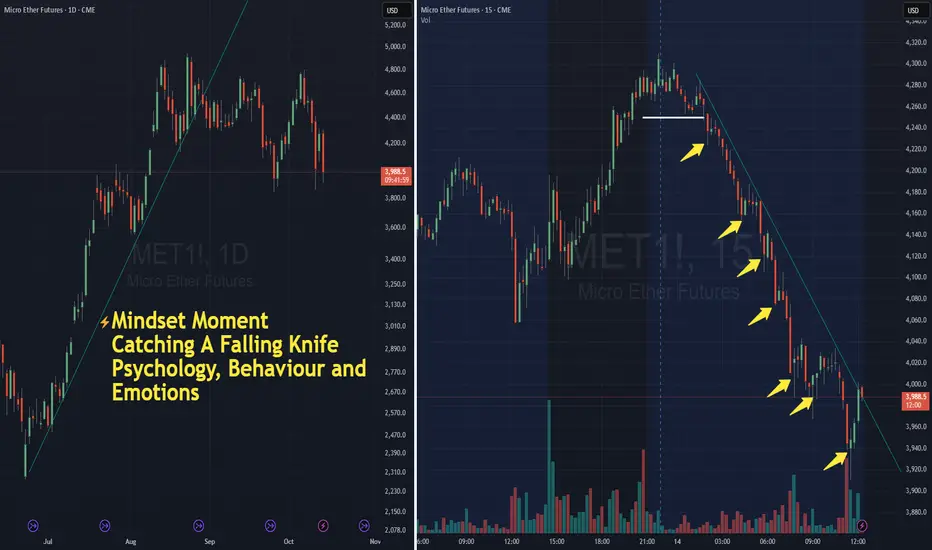
Catching a Falling Knife - The Illusion of OpportunityNOTE – This is a post on mindset and emotion. It is NOT a trade idea or system designed to make you money. My intention is to help you preserve capital, energy, and focus — so you can execute your own trading system with calm and confidence.
A sharp selloff.
Price is plunging.
The chart looks like
ETHUSD Fractal Inverse H&S H1/D1 - Daily Trade SetupsIn this update we review the potential for a fractal inverse head & shoulders scenario looking at the Daily & Intraday price action and identifying the next high probability trading opportunity and price objectives to target. To review today's video analysis click here!

BTC1 & ETH1 Daily Trade Setups 1/10/25in this update we review ht ercent price action inBitcoin & Ether futures and identfy the next high probability trade setups and price objectives to target. To review todays video analysis click below!

See all ideas
Summarizing what the indicators are suggesting.
Neutral
SellBuy
Strong sellStrong buy
Strong sellSellNeutralBuyStrong buy
Neutral
SellBuy
Strong sellStrong buy
Strong sellSellNeutralBuyStrong buy
Neutral
SellBuy
Strong sellStrong buy
Strong sellSellNeutralBuyStrong buy
A representation of what an asset is worth today and what the market thinks it will be worth in the future.
Frequently Asked Questions
The current price of Ether Futures (Nov 2025) is 3,074.0 USD — it has risen 1.60% in the past 24 hours. Watch Ether Futures (Nov 2025) price in more detail on the chart.
The volume of Ether Futures (Nov 2025) is 2.64 K. Track more important stats on the Ether Futures (Nov 2025) chart.
The nearest expiration date for Ether Futures (Nov 2025) is Nov 28, 2025.
Traders prefer to sell futures contracts when they've already made money on the investment, but still have plenty of time left before the expiration date. Thus, many consider it a good option to sell Ether Futures (Nov 2025) before Nov 28, 2025.
Open interest is the number of contracts held by traders in active positions — they're not closed or expired. For Ether Futures (Nov 2025) this number is 3.17 K. You can use it to track a prevailing market trend and adjust your own strategy: declining open interest for Ether Futures (Nov 2025) shows that traders are closing their positions, which means a weakening trend.
Buying or selling futures contracts depends on many factors: season, underlying commodity, your own trading strategy. So mostly it's up to you, but if you look for some certain calculations to take into account, you can study technical analysis for Ether Futures (Nov 2025). Today its technical rating is sell, but remember that market conditions change all the time, so it's always crucial to do your own research. See more of Ether Futures (Nov 2025) technicals for a more comprehensive analysis.