FDM.CA: Bullish Flag, awaiting confirmation (64%)Bullish Flag, awaiting confirmation (64%)
Pros:
Volume during post formation
Descending volume during flag formation
Volume at break out
Golden cross in blue
PPS above 50MA and 200MA
RS above 0 and ascending
R/R ratio above 4
ATR ascending
250RSI above 50 and ascending
Cons:
200MA flat
Target:
PT =
−0.050CAD
−3.56 MCAD
81.31 M
About FANDIFI TECHNOLOGY CORP.
Sector
Industry
CEO
David Vinokurov
Website
Headquarters
Vancouver
Founded
2006
FIGI
BBG000QX4SC9
Fandifi Technology Corp. engages in the development and monetization of mobile applications. It operates through the following geographical segments: Canada, Curacao, and Cyprus. The company was founded by Tristan Brett and Blair Lawrence Naughty on May 12, 2006, and is headquartered in Vancouver, Canada.

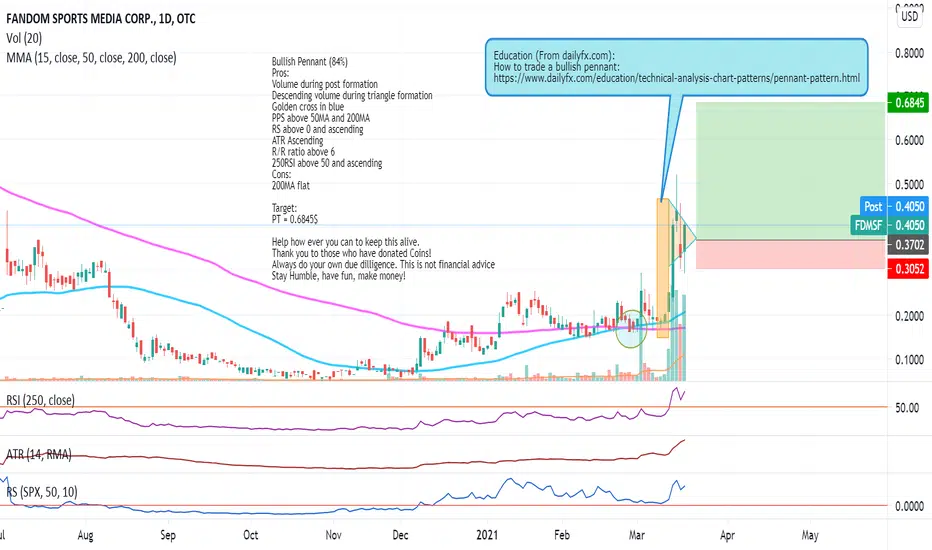
FDMSF: Bullish Pennant (84%)Bullish Pennant (84%)
Pros:
Volume during post formation
Descending volume during triangle formation
Golden cross in blue
PPS above 50MA and 200MA
RS above 0 and ascending
ATR Ascending
R/R ratio above 6
250RSI above 50 and ascending
Cons:
200MA flat
Target:
PT = 0.6845$
Help how ever you can to k
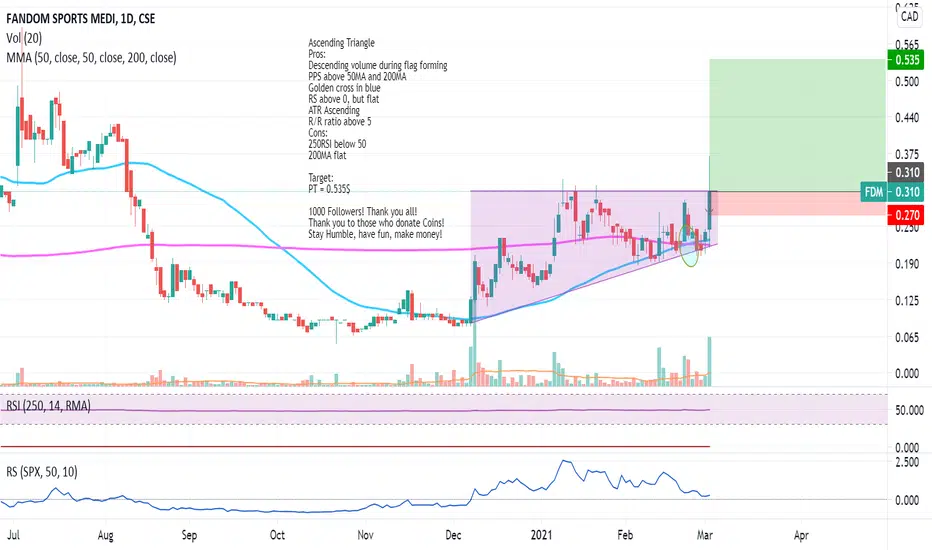
FDM.CA: Ascending TriangleAscending Triangle
Pros:
Descending volume during flag forming
PPS above 50MA and 200MA
Golden cross in blue
RS above 0, but flat
ATR Ascending
R/R ratio above 5
Cons:
250RSI below 50
200MA flat
Target:
PT = 0.535$
1000 Followers! Thank you all!
Thank you to those who donate Coins!
Stay Humble, ha


See all ideas
Trade directly on the supercharts through our supported, fully-verified and user-reviewed brokers.


Frequently Asked Questions
The current price of FDM is 0.005 CAD — it hasn't changed in the past 24 hours.
Depending on the exchange, the stock ticker may vary. For instance, on CSE exchange FANDIFI TECHNOLOGY CORP. stocks are traded under the ticker FDM.
FDM stock is 0% volatile and has beta coefficient of −2.31. Check out the list of the most volatile stocks — is FANDIFI TECHNOLOGY CORP. there?
Yes, you can track FANDIFI TECHNOLOGY CORP. financials in yearly and quarterly reports right on TradingView.
FDM stock hasn't changed in a week, the last month showed zero change in price, over the last year FANDIFI TECHNOLOGY CORP. has showed a 87.50% decrease.
FDM net income for the last quarter is −613.88 K CAD, while the quarter before that showed −613.88 K CAD of net income which accounts for 0.00% change. Track more FANDIFI TECHNOLOGY CORP. financial stats to get the full picture.
No, FDM doesn't pay any dividends to its shareholders. But don't worry, we've prepared a list of high-dividend stocks for you.
Like other stocks, FDM shares are traded on stock exchanges, e.g. Nasdaq, Nyse, Euronext, and the easiest way to buy them is through an online stock broker. To do this, you need to open an account and follow a broker's procedures, then start trading. You can trade FANDIFI TECHNOLOGY CORP. stock right from TradingView charts — choose your broker and connect to your account.
Investing in stocks requires a comprehensive research: you should carefully study all the available data, e.g. company's financials, related news, and its technical analysis. So FANDIFI TECHNOLOGY CORP. technincal analysis shows the sell today, and its 1 week rating is sell. Since market conditions are prone to changes, it's worth looking a bit further into the future — according to the 1 month rating FANDIFI TECHNOLOGY CORP. stock shows the sell signal. See more of FANDIFI TECHNOLOGY CORP. technicals for a more comprehensive analysis.
If you're still not sure, try looking for inspiration in our curated watchlists.
If you're still not sure, try looking for inspiration in our curated watchlists.