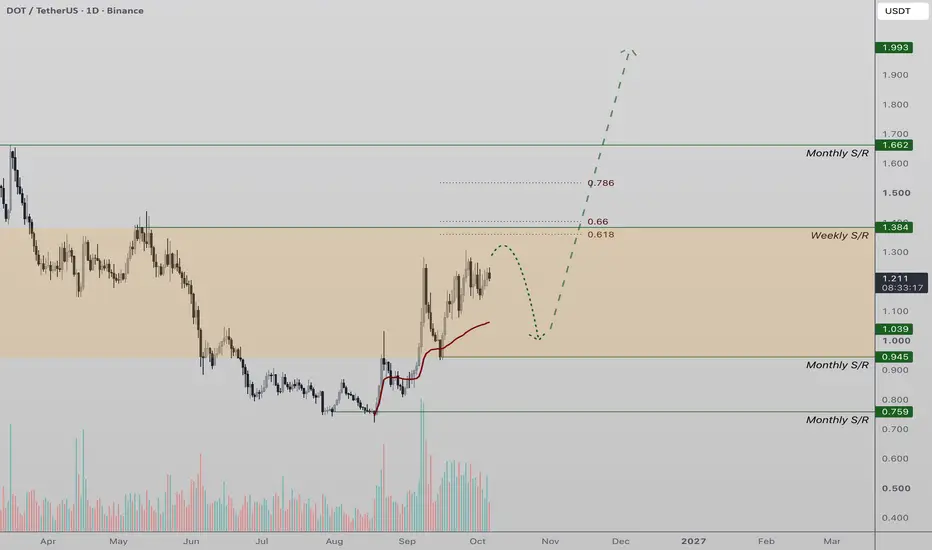
DOT Bullish Structure Holds Above Key SupportDOT price action continues to maintain a constructive bullish structure, forming consecutive higher highs and higher lows throughout the current rally. This suggests buyers remain in control of the broader short-term trend.
The key level to monitor is $0.94 support. As long as price action remains
Compare with DOT/USDT
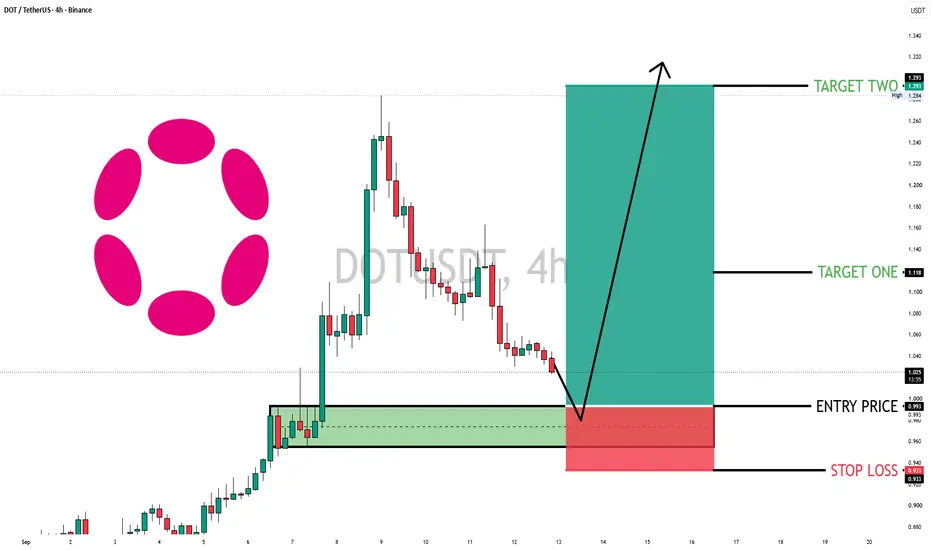
dotusdt longINSTRUCTIONS TO READ AND TO FOLLOW:
Entry point: yellow
Stop loss: red
Take profit: green or blue
👉Leverage x 5-10-20 for crypto
👉Leverage x 20-50-100 for commodities, stocks, indices, and forex
👉Margin 1-5% max:
This limits your maximum loss to 5% and guarantees that you retain 95% of your portfo
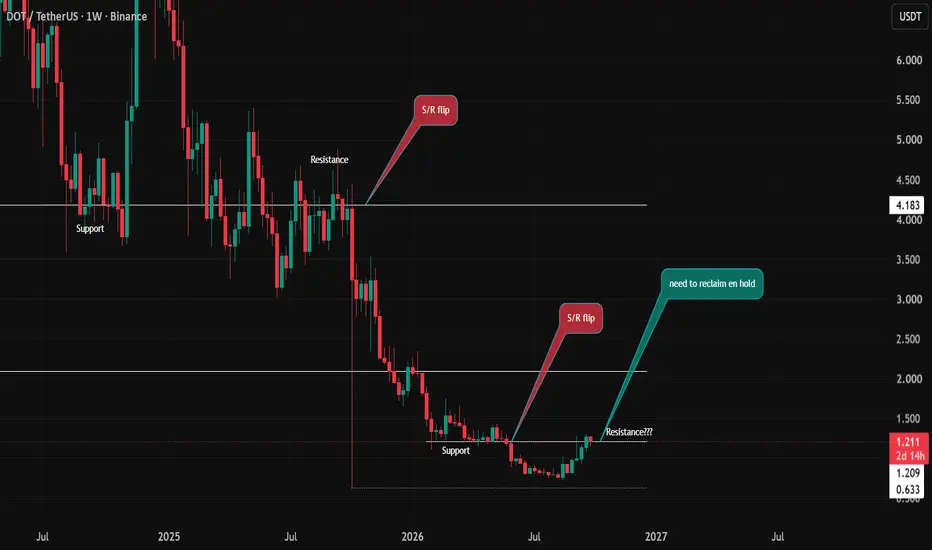
DOT - Key levels to watchDOT is showing signs of recovery after a prolonged downtrend, but the larger HTF structure remains bearish.
The key levels I'm watching:
$0.63 → Major HTF support
$1.21 → Current resistance / potential S/R flip
~$2.10 → Next important reclaim level
$4.18 → Major HTF resistance
Price is currently
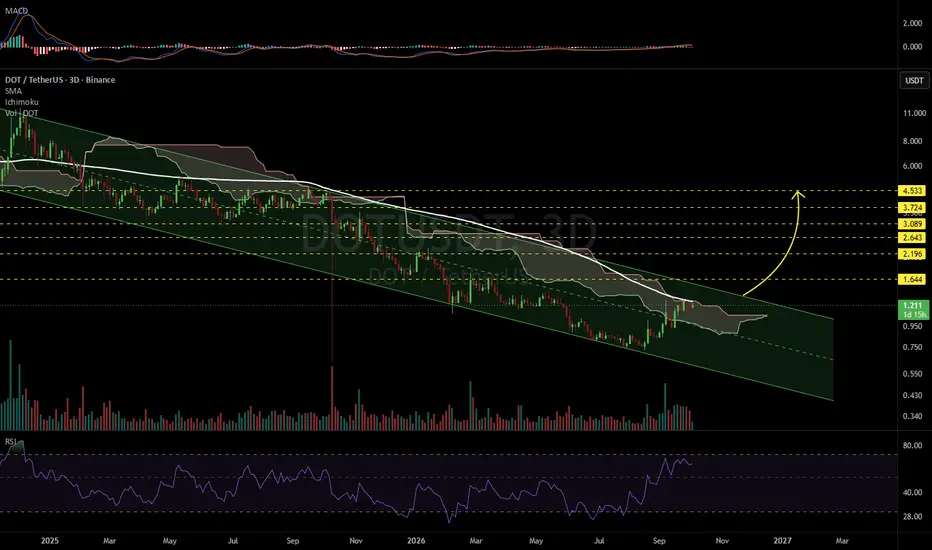
DOTUSDT 3D#DOT is moving inside a descending channel on the 3-day chart. It is currently testing the upper boundary of the Ichimoku cloud and the 3-day SMA100. For a bullish scenario, it must break above these levels as well as the channel resistance. If that happens, the potential upside targets are:
🎯 $1.6
Dot - The Awaking?DOT has spent almost 2 years trapped beneath this major descending trendline.
Every rally was sold.
Every attempt to recover failed.
But now something is changing.
DOT has pushed back toward the multi-year downtrend, and this is the exact area where the next major decision could happen.
🔥 The se
DOT Price Action Re-Accumulation ? DOT price action is currently trading above a high-timeframe support region around $1.10. This level has recently acted as an important area of demand, with price showing a reaction after testing the region. If DOT is able to maintain acceptance above this support over the coming weeks, it could pro
DOTUSDT Analyses-58, September 30, 2026
Welcome to my page! I share daily technical analyses of crypto and other charts here.
BINANCE:DOTUSDT
🔍 Market Structure Analysis:
DOT has turned bullish on the 1H chart, with higher lows and higher highs supporting the current bullish structure.
🎯 Entry & Exit Signal:
Buy Entry: 1.237
St
$DOT | 4H | BUY SETUP |Everyone is calling BINANCE:DOTUSDT a "dead zombie chain."
But the charts and tokenomics tell a completely different story.
Here is why the crowd is panic-selling right before a high-probability asymmetric opportunity. 👇
📊 THE OBVIOUS NARRATIVE vs. THE DATA
The retail crowd sees CRYPTOCAP:DOT
dotusdt longINSTRUCTIONS TO READ AND TO FOLLOW:
Entry point: yellow
Stop loss: red
Take profit: green or blue
👉Leverage x 5-10-20 for crypto
👉Leverage x 20-50-100 for commodities, stocks, indices, and forex
👉Margin 1-5% max:
This limits your maximum loss to 5% and guarantees that you retain 95% of your portfo
DOT: Rising Wedge Pattern-It's getting ready to fall DOT: Rising Wedge Pattern-It's getting ready to fall
DOT completed a bearish wedge pattern on the 4H chart. The price broke down of the pattern signaling a potential fall.
The previous 3 candles are all clear and bearish adding more value to the bearish scenario.
On the other hand, BTC is sti
See all ideas
Summarizing what the indicators are suggesting.
Oscillators
Neutral
Oscillators
Neutral
Summary
Neutral
Summary
Neutral
Summary
Neutral
Moving Averages
Neutral
Moving Averages
Neutral
Displays a symbol's price movements over previous years to identify recurring trends.
Frequently asked questions
The current price of Polkadot / Tether (DOT) is 1.1012 USDT — it has fallen −7.75% in the past 24 hours. Try placing this info into the context by checking out what coins are also gaining and losing at the moment and seeing DOT price chart.
Polkadot / Tether price has fallen by −7.01% over the last week, its month performance shows a 13.42% increase, and as for the last year, Polkadot / Tether has decreased by −73.39%. See more dynamics on DOT price chart.
Keep track of coins' changes with our Crypto Coins Heatmap.
Polkadot / Tether (DOT) reached its highest price on Nov 4, 2021 — it amounted to 55.0965 USDT. Find more insights on the DOT price chart.
See the list of crypto gainers and choose what best fits your strategy.
Polkadot / Tether (DOT) reached the lowest price of 0.7237 USDT on Aug 18, 2026. View more Polkadot / Tether dynamics on the price chart.
See the list of crypto losers to find unexpected opportunities.
The safest choice when buying DOT is to go to a well-known crypto exchange. Some of the popular names are Binance, Coinbase, Kraken. But you'll have to find a reliable broker and create an account first. You can trade DOT right from TradingView charts — just choose a broker and connect to your account.
Crypto markets are famous for their volatility, so one should study all the available stats before adding crypto assets to their portfolio. Very often it's technical analysis that comes in handy. We prepared technical ratings for Polkadot / Tether (DOT): today its technical analysis shows the neutral signal, and according to the 1 week rating DOT shows the neutral signal. And you'd better dig deeper and study 1 month rating too — it's sell. Find inspiration in Polkadot / Tether trading ideas and keep track of what's moving crypto markets with our crypto news feed.
Polkadot / Tether (DOT) is just as reliable as any other crypto asset — this corner of the world market is highly volatile. Today, for instance, Polkadot / Tether is estimated as 4.52% volatile. The only thing it means is that you must prepare and examine all available information before making a decision.
You can discuss Polkadot / Tether (DOT) with other users in our public chats, Minds or in the comments to Ideas.