Trade ideas

T - Range Bound Upside Play.Stock has been trading in a range since late March of 2020 and made a clearly defined zone up until Sep 2020, that is now trending again in 2021 from March to current. Currently it's testing 30.75, holding a zone and setting up to break with help from the market being lifted by Earnings Season starting next week.
Upside Target: 31.50 +
Downside Pullback: 29.75, 29.25

AT&TI'm not sure what was stated in their earnings report, but these are the levels that I'm paying attention to as I stalk it's price action.

4/14 TT is kinda slow so I post the weekly chart.
(1) Soon to exit the triangle zone (pink line)
(2) support at 27.49 steady
(3) should not be a problem to reach 31 or even higher until inside pink line.
(4) if it broke out the while pink triangle zone, scale in and hold.

AT&T (T)Restructuring savings and lower interest expenses should give support to margins, setting a rally in EPS to $3.30 in 2022 and around $3.90 by 2025. AT&T is very interesting as a yield (7.0%) play for income-focused
investors.


BULLISH MOMENTUMHELLO TRADER'S THIS IS MY BULLISH TREND ANALYZE . WAIT FOR COME KEY LEVEL AFTER TREND CONTINUE TO UPTREND YOU CAN ENTRY .THIS IS MY OPINION ONLY NO MORE SIGNAL .

$T Potential path to $39If we aren't able to break this trendline, i expect we'll come back down to ~28 before we finally clear this symmetrical triangle that has been forming since last February.
Once that triangle pattern is broken and we have a clear breakout, i expect we'll reach close to the top of this pitchfork at around $35 perhaps by EoY. This is also the median of the channel that has been forming for the past 2 decades. From there we can head back to pre covid highs at around $39 by mid to late 2022 perhaps?

ATT Potential for equal and opposite reactions into May. HBOMax Long setup. really did nothing since March selloff. Now forming inverse head and shoulders bottom as HBOMax is picking up subs.
YOLO Alert

Squeeze Incoming; 2.5 dtc A comp of $T and $VZ's stock. Similar setups, with VZ blazing ahead. $T seems a day behind. You can never be confident when playing short-term moves, but you can see the squeeze indicator Ppppin off prior to VZs move and it's doing it for T now. The rotation favors it, and it looks like some shorts might not have closed fast enough.
www.marketbeat.com
It's enough to place a small bet upon. I'm not a squeeze-hunter, but when it seems to be happening it's good to take a small position.

AT&T pushing to the 31.91 ResistantAT&T may arrive at the 31.91 resistant in the upcoming days. In this negative skewed volume environment, the majority of investors are concentrated on the previous week's close. This is an indicator of strength. It is, however, important to wait for confirmation. If the 31.91 l is broken, we can expect the price to rise to the next resistance level of 35, as investors keep on buying due to the optimistic TA.
Follow me in Etoro for more updates!
Dreguero


T - Elliott Wave update Previous Analysis of wave 2 (blue) was anticipated too early.
Lower degree of wave & was completed (magenta). Wave impulse upward should be underway
New target is 36.82 where wave 3 (blue) reaches 1.618 of wave 1(blue).

AT&T Is one of the most undevalued stock during this timeHere is one of the most undervalued stocks which is AT&T. Its price is 30$ and its intrinsic value is 109 $. So I believe this stock even if the market did not appreciate it yet, eventually will go toward its fair value.


Positive trends with new strategyBased on the Options Flow and other technical indicators (penant building) we can see clear bullish properties.
The recent change in strategies by John Stankey + Jason Kilar coupled with the increased insider buying ( while competition T-Mobile increased in insider selling!) hint to a possible explosive upward movement. ( + whales buying insane amount of calls )
At time of publishing:
T: Price to Book (FY) 1.3218 / Gross Profit (FY) 63.324B
T-Mobile: Price to Book (FY) 2.3966 / Gross Profit (FY) 26.632B
VZ: Price to Book (FY) 3.4518 / Gross Profit (FY) 60.371B
Price target: $38


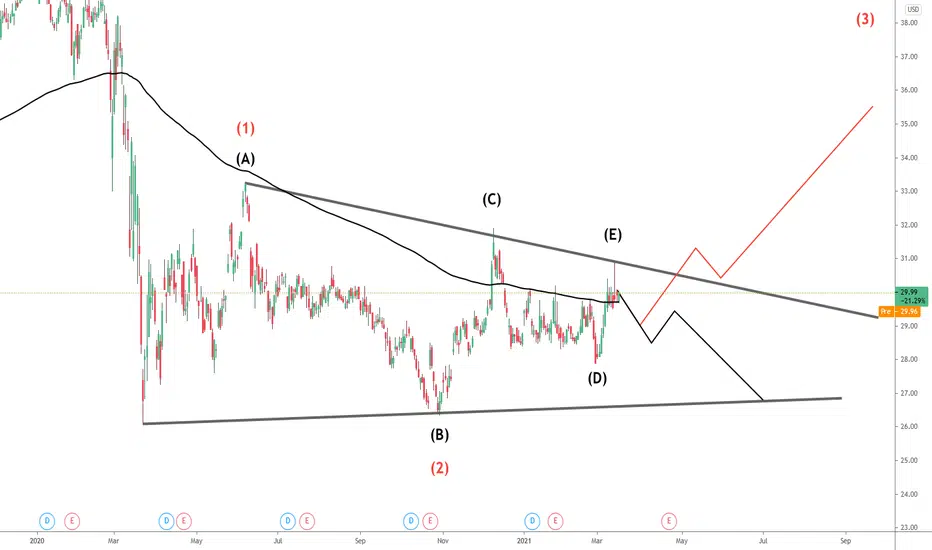
T - It may go up or it may go down :)(if it doesn´t go sideways)
We´re in no man´s land right now, and no trades should be taken. But I´m bullish (RED scenario) based on impulsive (B->C) x corrective (C->D) movements. Will only go long if trendline is broken.
Traditional|T|Long and shortLong and short T
Activation of the transaction only when the blue zone is fixed/broken.
Working out the support and resistance levels of the consolidation zone.
* Possible closing of a trade before reaching the take/stop zone.
The "forecast" tool is used for more noticeable display of % (for the place of the usual % scale) of the price change, I do not put the date and time of the transaction, only %.
The breakdown of the upper blue zone - long.
Breakdown of the lower blue zone - short.
Working out the stop when the price returns to the level after activation + fixing in the red zone.
Blue zones - activation zones.
Green zone - take zone.
Red zone - stop zone (S-SL short stop, L-SL long stop).
Orange arrows indicate the direction of the take.
Red arrows indicate the direction of the stop.
P.S Please use RM (risk management) and MM (money management) if you decide to use my ideas, there will always be unprofitable ideas, this will definitely happen, the goal of the system is that there will be more profitable ideas at a distance.


$T with a bearish outlook following its earnings #StocksThe PEAD projected a bearish outlook following a negative under reaction after its earnings release placing the stock in drift D
If you would like to see the Drift for another stock please message us. Also click on the Like Button if this was useful and follow us or join us.

HBO Max will turn T into a growth stonkBuy Att on HBO Growth prospects and get paid the insane divy while you wait
