Can SOFI reach $30.00 ? SoFi Technologies has successfully broken out of a falling channel, reclaiming the $13.00 level — now acting as a strong support and technical base. This breakout follows a clear downtrend rejection structure (marked by multiple red arrows), and is now transitioning into a bullish reversal pattern.
📊 Technical Highlights
Breakout Point: $13.00 – now confirmed as strong support.
Structure: Bullish flag/channel breakdown followed by a clean breakout and retest setup.
Pattern Projection Target: $30.32 (based on flagpole extension), indicating a potential 137% upside.
Short-Term Resistance: $16.58 (local top), then $18.41.
Support Zone: $13.00 key level to hold for bullish continuation.
Volume: Elevated volume on breakout candles, confirming strong demand absorption at breakout.
🧠 Trade Expectation
Price may enter a short period of consolidation or shallow pullbacks above $13 before stair-stepping higher through $16.50 and $18.40. If momentum sustains, a measured move to the $30 zone is achievable.
Trade ideas

$sofi is beyond short in any scenario SoFi (SOFI) presents a compelling short opportunity heading into the key economic data, as both likely macroeconomic outcomes create significant headwinds for its premium valuation. The core vulnerability is its ~60x forward P/E ratio, which prices in flawless execution and high growth. Any macroeconomic surprise threatens this narrative, making multiple contraction highly probable.
In a strong data scenario (economic resilience), the implications are unambiguously negative. This would push Federal Reserve rate cuts further into the future, causing Treasury yields to rise. For SoFi, this means the cost of funding its loans would remain elevated, squeezing its net interest margin. Crucially, higher-for-longer interest rates severely dampen consumer demand for its core products—personal loans, mortgages, and student loan refinancing—directly threatening its growth trajectory. The market would likely punish this growth scare with a severe derating of its high multiple.
A weak data scenario (economic softening) offers a mixed fundamental picture but will likely be interpreted bearishly by the market. While lower rates could stimulate some loan demand, the immediate focus will shift to credit risk. A slowing economy increases the probability of rising delinquencies and loan defaults within SoFi's consumer-focused portfolio. For a stock priced for perfection, this introduction of uncertainty and potential future credit costs is often a catalyst for selling. The market will likely focus on this risk rather than potential future volume growth.
The recent firing of a Federal Reserve official adds a layer of political uncertainty to monetary policy, which typically triggers a risk-off sentiment. High-growth, high-multiple stocks like SoFi are disproportionately sold in such environments. While company-specific news could theoretically offset these macro forces, the overwhelming pressure from the upcoming data release and the precarious technical setup suggest the path of least resistance is down. A break below key support levels could trigger a swift decline toward the $18 area.
Trading Implication: The confluence of macro sensitivity, rich valuation, and heightened uncertainty creates a high-probability short setup. Risk management, such as a stop-loss order to account for any unexpected positive news, remains essential.
SOFI - channel breakout after hours.SOFI - Stock Held 21 EMA levels on the daily. stock in uptrend channel and broke above $25 resistance level after hours. Possible more upside as long as $25 holds . next resistance at $30
SOFI LEAP Call Setup: Long-Term Fintech Moonshot?
# 🚀 SOFI LEAP Call Setup: Long-Term Fintech Moonshot? 💎📈 (2025-08-22)
📊 **Market Consensus Recap**
* 📈 Weekly RSI: 84.3 → strong bullish momentum
* 📉 Monthly RSI: 63.1 → fading momentum, overextended zone (99.1% of 52-week range)
* 💵 Institutional Flow: Neutral (Call/Put OI ratio = 1.00)
* 🌪 Volatility: Favorable (low VIX = good LEAP environment)
* ⚠️ Risk: Extreme valuation → caution on new entries
---
# 🎯 TRADE PLAN
* 🏦 Instrument: **\ NASDAQ:SOFI **
* 📈 Direction: **CALL (LONG)**
* 🎯 Strike: **27.00**
* 💵 Entry: **6.00**
* 🛑 Stop Loss: **4.20 (-30-40%)**
* 🎯 Profit Target: **11.40**
* 📅 Expiry: **2026-09-18**
* 📏 Size: **1 contract**
* 📈 Confidence: **75%**
* ⏰ Entry Timing: **Market Open**
---
⚠️ **Key Risks**
* 🚨 Overvalued at near 52-week high (99.1%)
* 📉 Potential correction to \$15–\$18 before next leg
* 📰 Macro/news shocks may hit fintech sentiment
---
# 📌 Hashtags
\#SOFI #OptionsTrading #LEAPs #StockMarket #LongTermInvesting #BullishSetup #Fintech #OptionsFlow #SmartMoney #TradingSignals #BreakoutTrading #SwingTrade

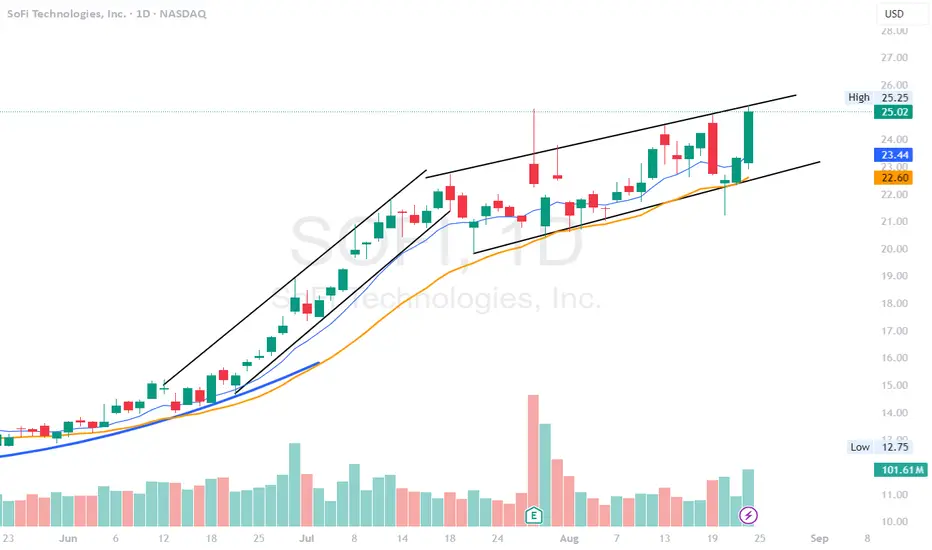
SoFI had a great run, but a healthy throwback is onSoFi is great stock. And it had a great run recently. Now it seems like the run has hit a HTF wall, and thus I expect either a horizontal distribution or immediate throwback before any continuation can occur.
I will refrain from any predictions otherwise, I'd rather wait for more PA to unfold. Anyway, if you are still in I would trim a lot here.

Watchlist Wednesday - $SPY, $MS, $SMH, $ASPI, $XLC, $XLK, $SOFIWatchlist Wednesday - AMEX:SPY , NYSE:MS , NASDAQ:SMH , NASDAQ:ASPI , AMEX:XLC , AMEX:XLK , NASDAQ:SOFI

Getting ready for another Sofi longSofi as expected had tremendously good earnings. The CEO is executing and I believe this will continue. At the current moment most of my Sofi trades have been LEAPs. I am planning on entering again with ultra safe in the money options. Stochastic is resetting, volatility was heating up and needs to cool off. Their stock offering right as the stock pumped was a good idea to quell the pump imo, and to get a good deal on offered shares (20.85$ share price). The fact that the stock has maintained the 5 EMA on the weekly for so long is astounding to me.
My plan:
If Sofi moves into the buy zone I will buy Jan 2027 15/17$ spread calls for exposure in my long account. I may or may not keep these to exercise, but I want exposure again. The last time I did this I rode them up 400-650%.
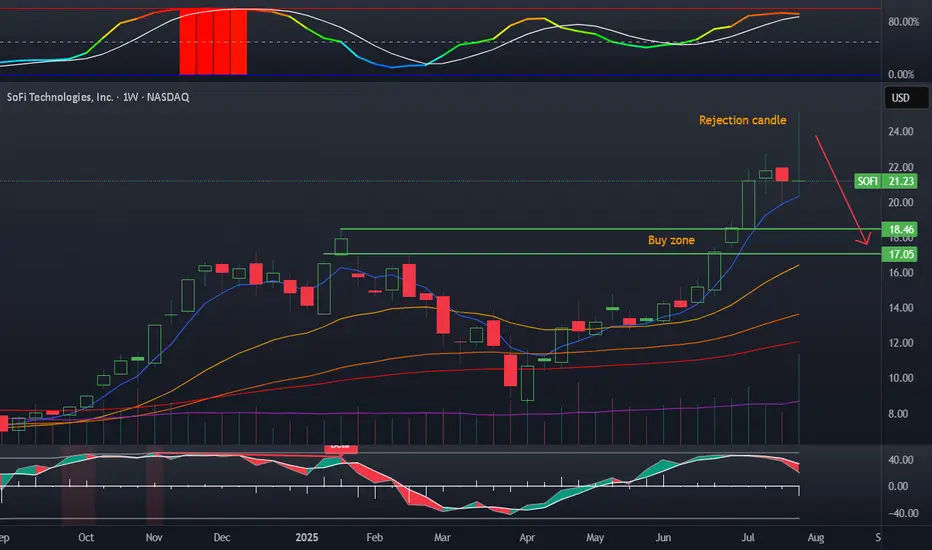
Sofi update dailyDespite my bearish post and a potential rejection candle. Sofi has chosen to keep chugging along. I will remain out of this trade, but am eyeing this heavily. I am seeing hidden bearish divergence, and a reset of volatility, which is needed.
I will sit on my hands here and wait for Sofi to do what Sofi does, it loves to give these back. A healthy 20% correction would be good for long-term price action as well. I will be loading up on LEAP spreads if we get there.

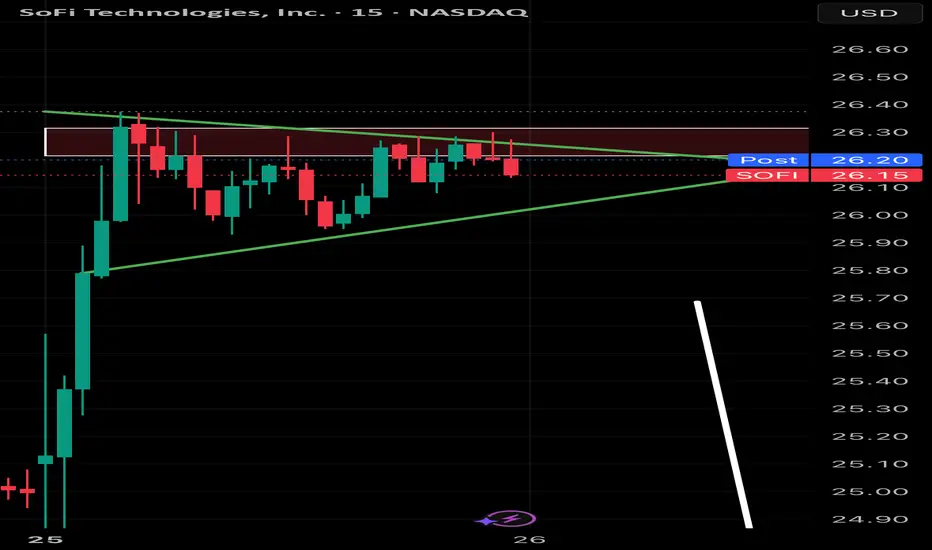
SoFi: Ascending TriangleSoFi Technologies rallied sharply in June and early July. Now, after a pause, some traders may see further upside.
The first item on today’s chart is the July 17 close of $22.09. The financial stock has remained mostly trapped below that level while making higher lows. The resulting ascending triangle is a potentially bullish continuation pattern.
Second, Bollinger Band Width has narrowed to its lowest reading since June 2024. Such tight consolidation may reflect a lack of selling pressure.
Third, the 8-day exponential moving average (EMA) has remained above the 21-day EMA. That may reflect bullishness in the short term.
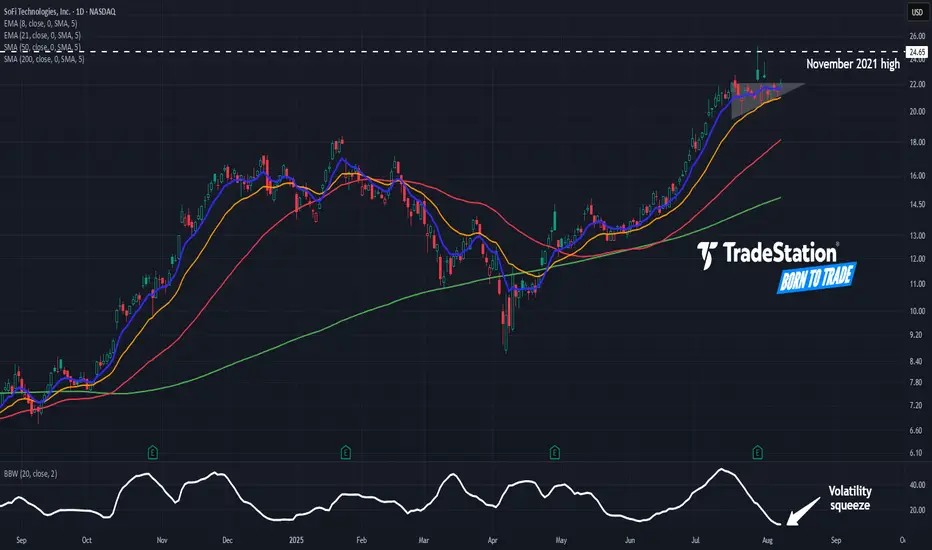
Next, prices are consolidating below previous record highs from 2021. (The peaks then ranged from $24.65 to $28.26.) Could the stock challenge its old highs?
Finally, SOFI is an active underlier in the options market. Its average volume of 411,000 contracts would rank 11th in the S&P 500 (if it were a member), according to TradeStation data. That could help traders take positions with calls and puts.
TradeStation has, for decades, advanced the trading industry, providing access to stocks, options and futures. If you're born to trade, we could be for you. See our Overview for more.
Past performance, whether actual or indicated by historical tests of strategies, is no guarantee of future performance or success. There is a possibility that you may sustain a loss equal to or greater than your entire investment regardless of which asset class you trade (equities, options or futures); therefore, you should not invest or risk money that you cannot afford to lose. Online trading is not suitable for all investors. View the document titled Characteristics and Risks of Standardized Options at www.TradeStation.com . Before trading any asset class, customers must read the relevant risk disclosure statements on www.TradeStation.com . System access and trade placement and execution may be delayed or fail due to market volatility and volume, quote delays, system and software errors, Internet traffic, outages and other factors.
Securities and futures trading is offered to self-directed customers by TradeStation Securities, Inc., a broker-dealer registered with the Securities and Exchange Commission and a futures commission merchant licensed with the Commodity Futures Trading Commission). TradeStation Securities is a member of the Financial Industry Regulatory Authority, the National Futures Association, and a number of exchanges.
Options trading is not suitable for all investors. Your TradeStation Securities’ account application to trade options will be considered and approved or disapproved based on all relevant factors, including your trading experience. See www.TradeStation.com . Visit www.TradeStation.com for full details on the costs and fees associated with options.
Margin trading involves risks, and it is important that you fully understand those risks before trading on margin. The Margin Disclosure Statement outlines many of those risks, including that you can lose more funds than you deposit in your margin account; your brokerage firm can force the sale of securities in your account; your brokerage firm can sell your securities without contacting you; and you are not entitled to an extension of time on a margin call. Review the Margin Disclosure Statement at www.TradeStation.com .
TradeStation Securities, Inc. and TradeStation Technologies, Inc. are each wholly owned subsidiaries of TradeStation Group, Inc., both operating, and providing products and services, under the TradeStation brand and trademark. When applying for, or purchasing, accounts, subscriptions, products and services, it is important that you know which company you will be dealing with. Visit www.TradeStation.com for further important information explaining what this means.
SOFI Setup Before Gamma Squeeze?
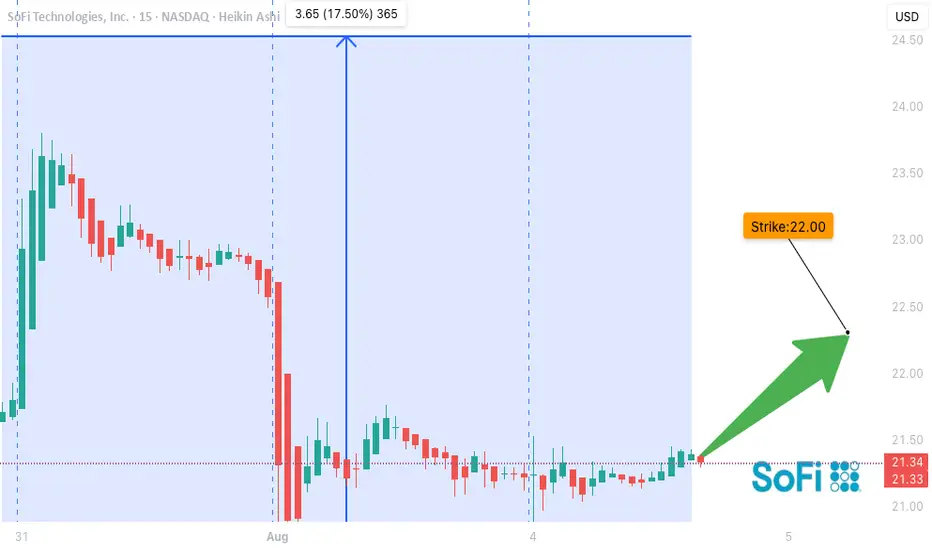
## 🐂 **SOFI WEEKLY OPTIONS BREAKOUT SETUP (Aug 4–8)**
**🔥 Bullish Momentum + Institutional Volume Surge = \$22 CALL in Play**
---
### 📌 Summary:
* **Weekly RSI** rising 📈
* **Volume** 2.5x average – strong institutional presence 🏦
* **Options Flow** favors calls: aggressive accumulation
* **Gamma Risk** into Friday + VIX stable ✅
* **Daily RSI** soft = potential dip before rip
---
### 🛠️ Trade Setup:
| Type | Direction | Strike | Expiry | Entry | Stop | Target | Confidence |
| ------ | --------- | ------- | ------ | ------ | ------ | ------ | ---------- |
| Option | CALL | \$22.00 | Aug 8 | \$0.34 | \$0.17 | \$0.68 | 70% ✅ |
💡 **Watch for breakout over \$21.50** — potential gamma squeeze to \$23+
📉 Manage risk below \$21.00 / VIX spike
⚠️ Earnings & macro could add volatility
---
### 🧠 Model Consensus:
* **Grok/xAI**: Strongly bullish, confirms flow & breakout potential
* **Claude & Meta**: Volume confirms upside, but caution on RSI
* **Gemini**: Neutral on daily, bullish long-term
* **DeepSeek**: Momentum trend intact, supports call strategy
---
### 📊 Tag Zone:
`#SOFI #Options #TradingView #Bullish #GammaSqueeze #CallOption #VolumeBreakout #WeeklySetup #MomentumTrading #SmartMoney`
SOFI - Pricing inside the Up trend channelHello Everyone,
Happy Sunday to All.
Today my second anaylze for SOFI Technologies .
It is still in UP trend and pricing in BLUE Channel.
I drew 2 possible scenario in Graphs as Yellow and Red.
If it will break 20.30 then it could reach the 18.30 - 18.10 which is buttom level of UP Trend worst case scenario 17.70 - 17.80.
You can monitor these levels then you can make your decisions.
Second option is hit 20.20 - 20.30 and go up and try to hit Above level of UP trend line.
25.00 - 25.20 is TP1
27.30 - 27.50 is TP2
If it will break the 27.50 then I can anaylze later but most probably it will continue to go UP after this level.
This is just my thinking and it is not invesment suggestion , please do not make any decision with my anaylsis.
Have a lovelly Sunday
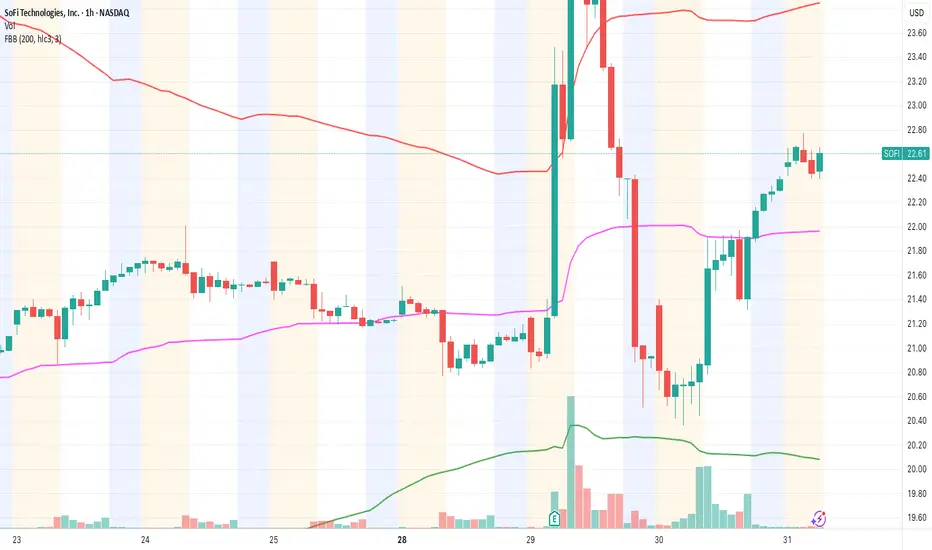
SOFI meets 25 out of 28 technical & fundamental criteria – SwingEntered at $22.55 after full validation through our 28-criteria system.
✅ Strong earnings (positive revenue growth & stable forward guidance)
✅ Dilution concerns cleared (no new share offering)
✅ Breakout confirmed above VWAP with clean pullback
✅ Accelerated momentum and rising premarket volume
✅ Healthy RSI (no overbought in 4h or daily chart)
✅ No major resistance until the $24.90–$25.20 zone
📍Key Levels:
🎯 Entry: $22.55
🛑 Stop Loss: $21.80
🎯 Target: $25.00
⏳ Expected duration: 1–2 days (swing)
🔁 Risk/Reward: 2.5:1
Fibonacci insight:
Price respected the 38.2% level during the pullback. The 161.8% extension points right to the $25 zone.
📊 Context:
Fintech sector is gaining strength, and SOFI is leading with strong fundamentals and bullish momentum.
If we open above $22.50 with strong volume, I expect a bullish continuation.
I'm tracking every trade as part of a new system currently under test.
If you want to follow this signal to the end, feel free to follow along. ✌️
My thoughts for the coming weeksWe are at a tough patch now unfortunately looking at the charts, and so I think it's safe to assume we will see some selling and slowing down in upward price action, until we find more momentum to carry us into price discovery.
As you can see, we're heading towards some very important areas. One being an old support level, now resistance. Following that we have the Fibonacci golden zone at an arms reach as well. If we manage to blow past those, we then have the big one which completely ruined us for years.
Conclusion:
As you can see from my comments on the chart, I can see us in the coming weeks cooling off, and eventually selling down towards the $10 range, to then eventually gain momentum and try again.

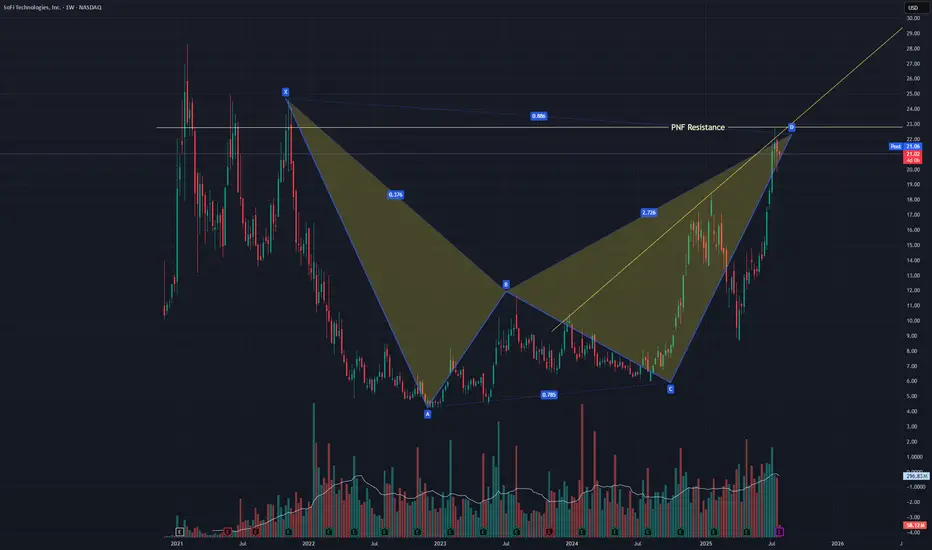
SOFI Pullback most likely comingNASDAQ:SOFI just finished a bearish bat harmonic and failed to break a resistance line I have from a PNF chart. It also failed a back test of a trendline of resistance in this uptrend. A pullback is likely but in this irrational market any thing could happen. I did a strangle +-5% just in case. I would not be surprised if I can close both with 20%+ profit.
SoFi: On the Road to ATH ResistanceAfter clearing over 100 lines off my chart, I wanted to take a clean, fresh look at SoFi heading into the upcoming earnings report — just to gain a new perspective on where we stand.
Weekly chart. As simple as it gets.
What I’m seeing: a breakout from a classic cup-and-handle formation, with the breakout point around $16.5.
This setup carries potential for a move toward all-time highs near $28.
— Important note:
A pullback to the $16.5 zone would still not break the breakout structure — in fact, this would be a textbook retest of the breakout level.
Yes, there’s still room for a ~20% downside from current levels, but this would still be within the structure of a larger bullish move toward ATH.
No doubt in my mind — if we revisit $16.5, I’ll be loading up on SOFI like crazy.

SoFi's Surge: Unveiling 2023 and What Lies Ahead in 2024Technical Analysis Overview
Current Price : $10.34, a 3.77% increase.
Weekly Trend : Showing a positive trend with a 5.35% increase over the last five days.
1-Month Trend : A significant increase of 51.96%, indicating strong bullish sentiment.
6-Month and Yearly Trends : A 17.04% increase over the last six months and a 124.51% increase year to date, highlighting a robust bullish trend.
Advanced Technical Indicators
Relative Strength Index (RSI) : 70.41 - Indicating that SOFI is nearing overbought territory, which could lead to a potential reversal or consolidation in the short term.
Moving Average Convergence Divergence (MACD) : 0.63 - Suggesting bullish momentum, indicating a strong buying trend.
Other Indicators : STOCH (83.28), STOCHRSI (84.02), ADX (37.09), Williams %R (-8.57), CCI (104.63), ATR (0.46), Ultimate Oscillator (54.76), and ROC (24.66) all contribute to a picture of current bullish momentum but with potential for short-term volatility or pullback.
Market Sentiment and External Factors
Market Capitalization : $9.904B USD.
Trading Volume Analysis : A high trading volume of 35,199,288, suggesting active market participation and interest in the stock.
Recent News Coverage Impacting SOFI
Bullish Outlook for 2024 : Analysts predict SOFI stock could continue its rally in the new year, benefiting from expected interest-rate cuts. A notable analyst has set a high price target of $14 for SOFI stock, implying significant upside potential ( InvestorPlace ).
Focus on Non-Lending Businesses : Analysts appreciate SoFi's shift towards non-lending businesses, improving earnings quality despite a higher-for-longer interest-rate policy.
Central Bank Policy Changes : Potential interest rate cuts in 2024 could benefit SoFi's lending business, as lower rates tend to spur borrowing and lending activity.
Conclusion
SOFI's stock shows strong bullish signs in the medium to long term, but the current overbought condition warrants caution for short-term traders.
The recent news and analyst predictions provide a positive outlook for 2024, making SOFI an interesting stock for both traders and long-term investors.

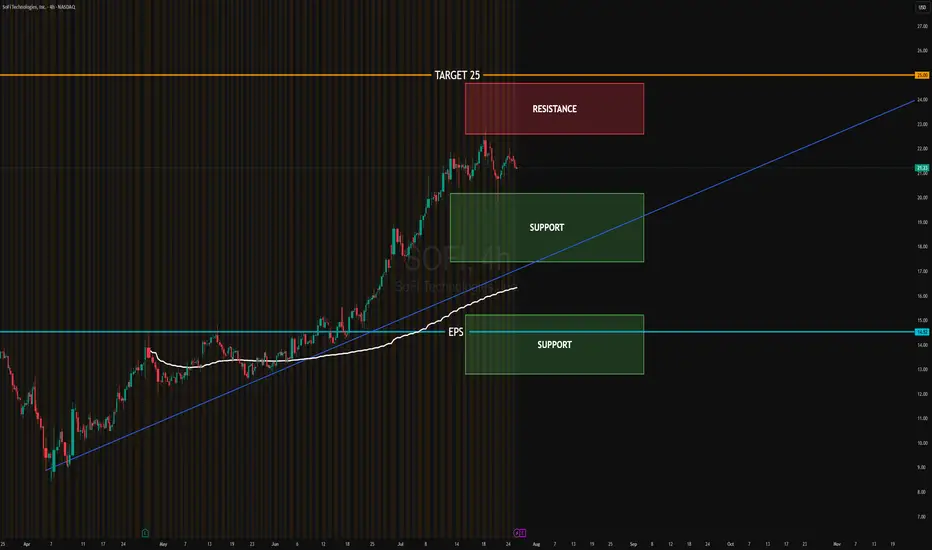
SOFI EARNINGSResistance Zone: $22.50 – $24.00
Support Zone 1: $18.00 – $19.50
Support Zone 2 / EPS Breakout Line: $14.50
Bullish Target: $25.00
Trendline: Still intact — medium-term trend remains bullish
Why We See 100%+ Upside In SoFi Over The Next 3 YearsAfter soaring to nearly $28 per share during the SPAC-fueled fintech boom in 2021, SoFi Technologies (SOFI) crashed back to earth, trading under $5 as rising interest rates, regulatory headwinds, and lack of profitability dimmed investor optimism. But the tide has turned.
Over the past year, SoFi has reshaped its business and posted significant growth. Shares are now up 247% since our previous bullish call at $6. With the company now profitable and diversifying revenue, we'd argue there’s still upside ahead.
💼 A Stronger, Diversified Business
SoFi has evolved from a student loan-focused lender into a full-spectrum fintech platform. It now operates across:
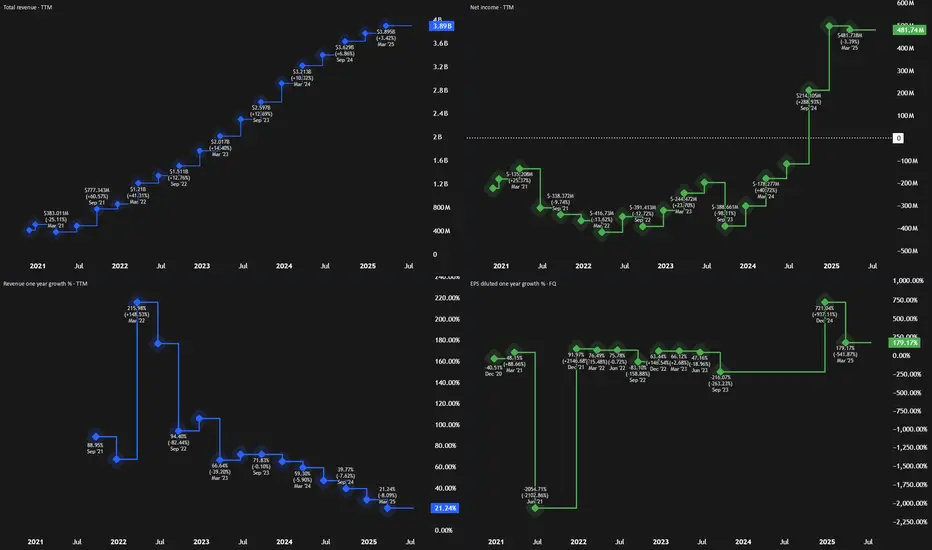
Lending: $413M in Q1 revenue
Financial Services (consumer banking): $303M
Technology Platform (B2B): $103M
While lending still makes up the majority, the tech and services segments are growing fast—especially financial services, which doubled revenue YoY and tripled profit. SoFi's white-label platform also gives it a SaaS-like recurring revenue profile.
Q1 results showed:
Revenue: $770M (+33% YoY)
EPS: $0.06, with a $31M revenue beat
This business mix gives SoFi more stability and better scalability than many traditional financial firms.
💰 Valuation: Pricey vs. Banks, Cheap vs. Fintech
Critics point to SoFi’s rich valuation—trading at over 8x sales—as a concern. But when compared to other fintechs like NuBank (12x sales) and Robinhood (28x), SoFi looks much more reasonably priced.
On a forward earnings basis, SoFi trades at ~32x GAAP EPS, and if growth continues, this could drop below 30x. That’s appealing for a company expected to grow:
Revenue: ~25% annually
Net income: ~33% annually
By 2027, analysts project $1B in operating income, double today’s figure. If SoFi maintains current valuation multiples, this alone could double the stock in 3 years.
⚠️ Risks to Watch
Regulatory scrutiny in the financial sector
Cyclicality of consumer lending
Intense competition from firms like Robinhood, Chime, and Coinbase
Despite these challenges, SoFi’s expanding ecosystem and growing brand strength position it well.
✅ Final Take: Still a 'Strong Buy'
With accelerating revenue, expanding margins, and a scalable business model, SoFi has moved beyond its hype-fueled origins and is now a real fintech contender. Even after its rally, its valuation still leaves room for meaningful upside.
Rating: Strong Buy
Parallel StructureWe have a nice parallel structure sitting on top of a 50 EMA (in blue). A consolidation is happening. Interestly enough the 200 EMA(in orange) is close to the 0.382 Fib level. On the weekly chart you can see the bears gearing up. But the bulls are still in charge. Price needs to hold the 20.64 price range for the bulls.
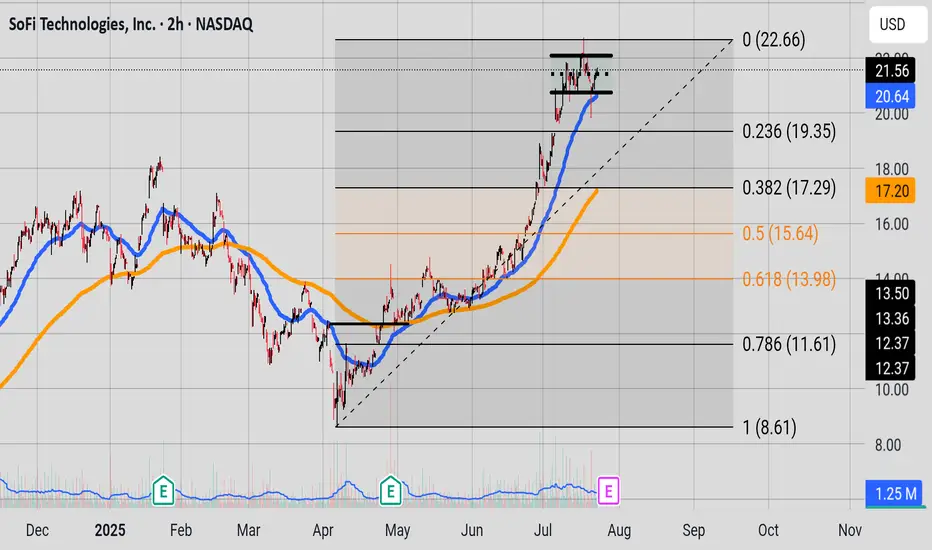
High Wave CandleSOFI has finally reached it's resistance level around 23.84. Last week candle was a High Wave Candle. If we get a strong close above 23.84 that probably means the bulls are marching on, if we get a bearish close below 19.55 that may mean the bears have stepped in and are looking to pull prices down to the golden zone of the Fib Level. Observe the bearish divergence with the RSI and price, also observe how Stochastic RSI and RSI are in overbought territory.

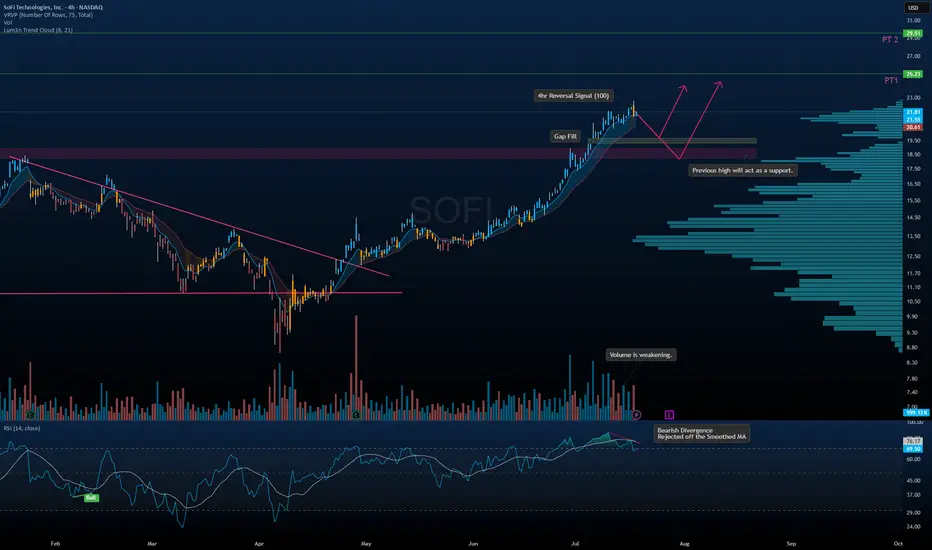
$SOFI - Long-Term Setup Brewing? Pullback First?I’m extremely bullish on SoFi long-term, but the chart is signaling a potential pullback opportunity before the next leg up.
🔹 Technical Breakdown:
• Bearish Divergence on RSI with rejection off the smoothed MA
• Volume weakening as price moves higher – classic sign of exhaustion
• 4hr Reversal Signal flashing near local highs
• Gap Fill zone near $19.50 + previous highs = strong support zone
• Lum3n Trend Cloud still bullish — trend intact unless breakdown occurs
🎯 Targets:
• PT1 → $23.25
• PT2 → $29.50 (longer-term structure extension)
🧠 Thesis:
Letting price come to us is the smarter move here. I’m watching the $19.50–$20.00 zone closely for potential accumulation. That level has strong confluence with volume shelf, support, and fib structure.
How to Do Your “Trading Homework” (The Smart Way)
If you’ve been following this channel, you’ve heard me say it many times:
Trading is war — and you should never enter a battle unprepared.
But here’s the real question:
How exactly do you prepare?
The answer lies in a powerful strategy I use called:
💡 Thematic Investing
Read more here →
Instead of chasing news or signals in isolation, thematic investing means:
You first understand where the world is heading
Then you position yourself ahead of that move
It’s not about reacting. It’s about anticipating.
---
❌ What Most Traders Do Wrong
Most beginners:
Follow one tweet
See one red or green arrow
Watch one chart pattern
Then they jump in blindly.
That’s not trading — that’s guessing.
News headlines and chart moves reflect what already happened.
But your edge comes from understanding what’s likely to happen next.
---
✅ What I Do Instead (with QS AI)
Back in the day, doing thematic analysis manually could take hours of reading across dozens of news sites, earnings calls, and macro reports.
But now?
QS AI does the heavy lifting for you — in seconds.
Here’s how I do my “trading homework” every week using QS signals:
---
🧠 Step 1: Start with the News Theme
Go to 📰news-signal — let the AI scan hundreds of headlines and summarize the key themes shaping the week.
Ask yourself:
What’s the main event or policy shift?
Which sectors are directly impacted?
Who are the winners and losers?
---
🔎 Step 2: Zoom Into Sectors or Stocks
Once you spot a theme, use other QS signals to dig deeper:
⏰0dte for fast-moving trades (same-day catalysts)
📅weekly-options for 1–5 day plays
💸earning-signal for earnings-related positioning
🔄swing-signal for broader trend/position trades
---
📈 Real Examples of Thematic Trades
Let me walk you through a few past trades — all built off this exact process:
✅ BBB Defense Play
Theme: Bill passed removing EV credits, boosting defense
Strategy: Long PLTR / Short EV sector using 📅weekly-options
✅ Robinhood Crypto Tokenization
Theme: Robinhood’s crypto product event
Strategy: Crypto stocks pump → took profits early
✅ Tesla Robotaxi Week
Theme: TSLA reveals AI & robotaxi push
Strategy: Long TSLA / Short UBER
✅ Earnings Play: MSFT vs AAPL
Theme: MSFT cloud beat, AAPL revenue drop
Strategy: Long MSFT / Short AAPL using 💸earning-signal
All these trades started with thematic awareness → followed by precise signal-based execution.
---
⚙️ Your Homework Checklist (The QS Way)
Before every week or trade, ask:
📰 What is the major theme driving markets this week?
🧠 What sectors or companies are most impacted by this theme?
🔀 Can I find a relative strength/weakness pair to trade?
⏳ What’s the best time frame? (0DTE, weekly, swing?)
📊 What do QS signals say about timing, momentum, and volatility?
---
🤖 Why QS AI Gives You the Edge
Doing this manually would take you 5–10 hours a week.
But with QS AI:
You scan the entire news cycle in 10 seconds
Get real-time themes and reactions
Pair it with high-quality trade setups
Prepare your game plan before the market opens
This is how we prepare smarter, not harder.
No more chasing arrows.
No more gambling.
Just clean, thematic, risk-aware, high-conviction trades.
---
🏁 Final Thought
There are no guarantees in trading.
But there is a smarter way to prepare.
Thematic investing + QS AI gives you the best shape to step into the market and fight with confidence.
Follow where the world is going — one theme at a time.
That’s how we trade with QS. That’s how we print. 🧠💥💰

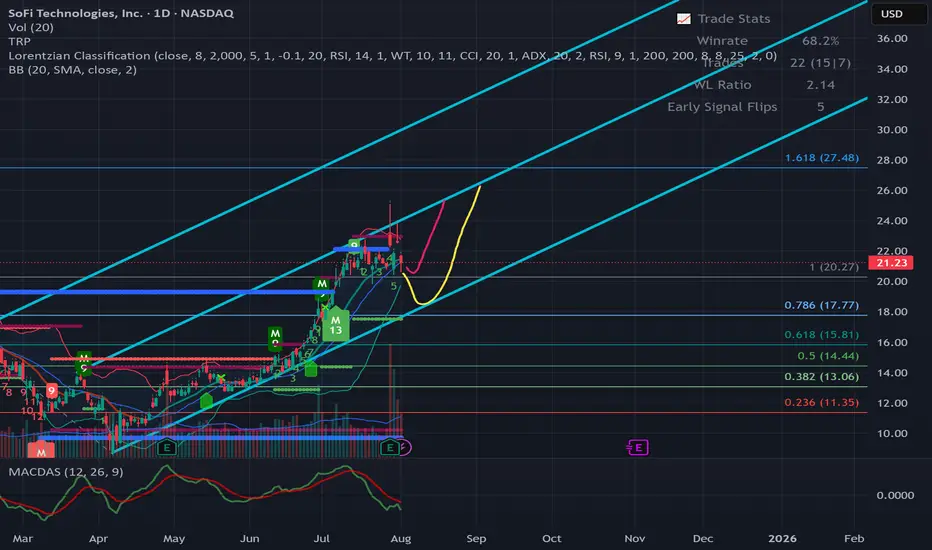
LONG 4HR Wave Count Possibilities
Using the Weekly time frame, Wave 1+3 of a larger degree shows a possible extension to the 1.68 extension which is a common wave 5 of a larger degree target . That Price Target being $26.35.
In April of this year the price reacted to a Reversal Pivot Point but failed to form a proper impulse for wave 1. Price then gapped above the price resistance line for the year of 2025 and the 100 WMA.
As of now, price is expect to target $19.43 in a move to finish out wave 3 of a macro degree. Wave 4 typically retracing to the 0.236 or 0.382 level has been displayed to align with the current uptrend trendline.
I have also displayed the possible points of interest for Fib levels for an approach to finish out wave 5 of a macro degree. I expect Price to stall and face resistance in the golden pocket extension of the Fib levels.
None of this is financial advise and strictly for educational purpouses.
