Cintas CorporationCintas Corporation operates within the business services sector, providing corporate uniform programs, workplace safety solutions, facility services, and related operational support for businesses across multiple industries. Due to its diversified client exposure and recurring-service business model
Cintas Corporation
No trades
No trades
Peers for comparison
4.42 EUR
1.71 B EUR
9.66 B EUR
339.90 M
Next report date
—
Report period
—
EPS estimate
—
Revenue estimate
—
Company info
Sector
CEO
Todd M. Schneider
Website
Headquarters
Cincinnati
Founded
1968
IPO date
Jan 1, 1983
ISIN
US1729081059
CUSIP
172908105
FIGI
BBG00FGWY992
Identifiers
ISIN US1729081059
Cintas Corp. engages in the provision of corporate identity uniforms through rental and sales programs. It operates through the following segments: Uniform Rental and Facility Services, First Aid and Safety Services, and All Other. The Uniform Rental and Facility Services segment consists of the rental and servicing of uniforms and other garments including flame resistant clothing, mats, mops and shop towels, and other ancillary items. The First Aid and Safety Services segment includes first aid and safety products and services. The All Other segment contains fire protection services and its direct sale business. The company was founded by Richard T. Farmer in 1968 and is headquartered in Cincinnati, OH.
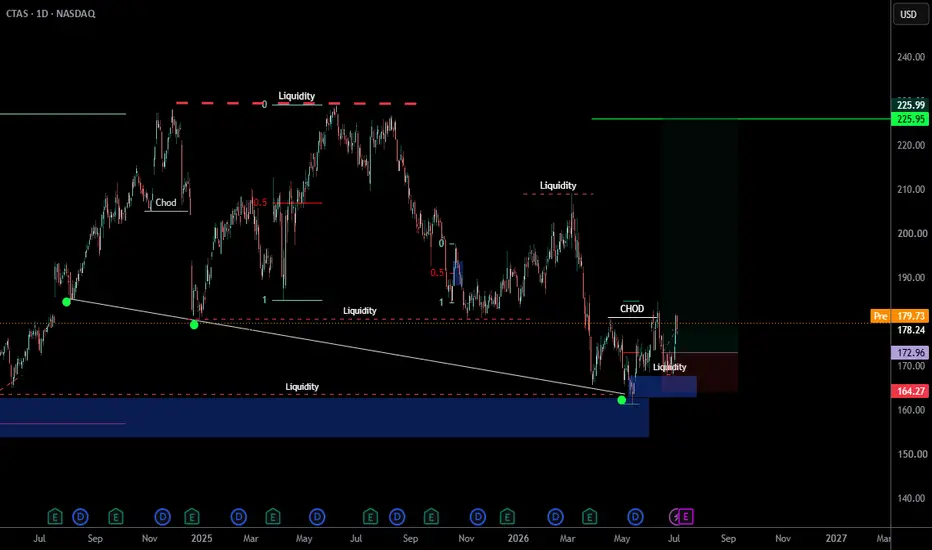
CTAS — Technical + Fundamental Analysis | LONG SETUPAnalysis powered by proprietary software for multi-timeframe technical scoring and integrated fundamental valuation.
Entry: $209.90
**Stop Loss:** $193.70 (-7.7%)
Take Profit: $243 (+15.8%)
R/R: ~2.05
🔍 Company Overview & Recent Results
Cintas (CTAS) reported Q4 FY2026 results on July 15, posting
$CTAS double topping up my soap dispenser...2 Fold.
1. Sneaky/Abusive business practices. Cheap products.
2. Capex Trajectory: Office < Data Centers
auto-renewal regulation. U.S. states and the FTC have been tightening automatic-renewal and "click-to-cancel" rules. If enforcement makes evergreen clauses harder to defend, the retention and
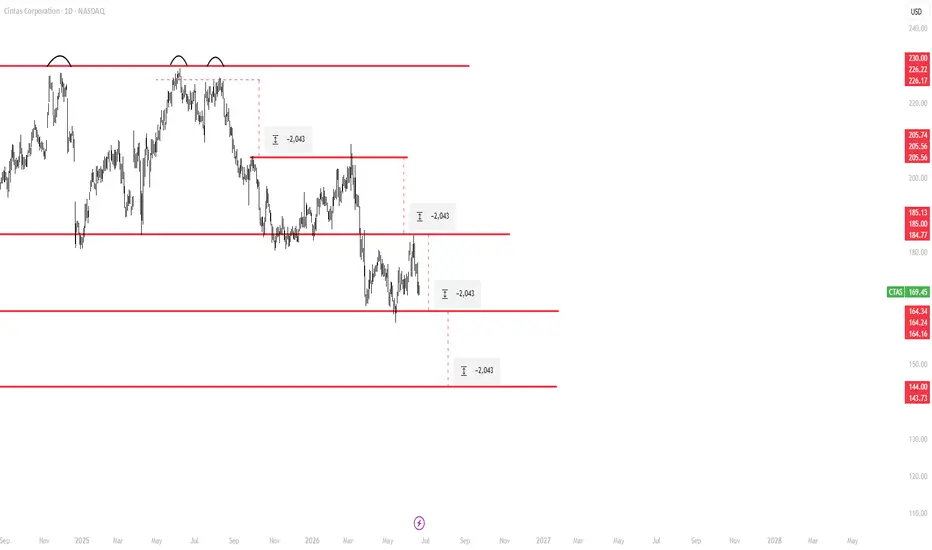
CTAS H&S chart Bearish already breaking down
Looks like support is back at H&S target and long term up trendline
Reasons to be bearish
1. Premium valuation (biggest risk)
CTAS trades at ~34–42x earnings, well above market averages.
Metrics like:
Price-to-book ~13x
EV/Sales ~6x (vs ~2x sector)
➡️ This means:
T
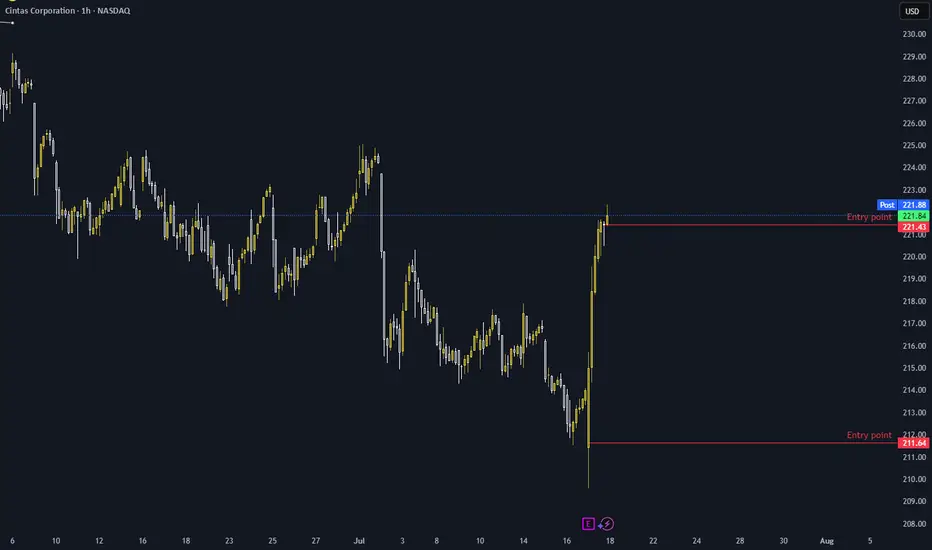
$CTAS $5.5B UniFirst Deal. Earnings Tomorrow. Weekly Demand ZoneCintas just made the biggest move in its history. On March 11, 2026, the company announced a definitive agreement to acquire UniFirst Corporation for $310 per share in cash and stock, representing an enterprise value of $5.5 billion.
The combined company will serve approximately 1.5 million busine
CTAS at All-Time Highs: Time to Book Profits?Cintas Corporation (CTAS) has been on a remarkable bullish journey, delivering consistent gains for patient investors. However, recent price action suggests that a key moment of decision has arrived.
📌 Weekly Demand Zone Gave a Strong Push 📌
After forming a fresh all-time high, CTAS saw a healthy
See all ideas
Summarizing what the indicators are suggesting.
Neutral
Neutral
Neutral
An aggregate view of professional's ratings.
Neutral
Neutral
Neutral
Displays a symbol's price movements over previous years to identify recurring trends.
Maturity dateAug 15, 2036
Coupon6.15% (Fixed)
Maturity dateMay 1, 2032
Coupon4.00% (Fixed)
Maturity dateApr 1, 2027
Coupon3.70% (Fixed)
Maturity dateMay 1, 2028
Coupon4.20% (Fixed)
See all CIT bonds
Frequently asked questions
Today, CIT trades at 199.20 EUR.
For broader market analysis, dive into the technicals on the Cintas Corporation stock price chart and read the latest CIT news:
– The Beauty Behind 'Boring' Stocks During Market Volatility
– Weekly Recap: FTC plans UniFirst deal suit and merger aims to cut costs
– UniFirst/Cintas spread narrows on report FTC hasn't indicated it will block deal (update)
For broader market analysis, dive into the technicals on the Cintas Corporation stock price chart and read the latest CIT news:
– The Beauty Behind 'Boring' Stocks During Market Volatility
– Weekly Recap: FTC plans UniFirst deal suit and merger aims to cut costs
– UniFirst/Cintas spread narrows on report FTC hasn't indicated it will block deal (update)
Markets don't sleep, here's what's going on with CIT at the moment:
– The Beauty Behind 'Boring' Stocks During Market Volatility
– Weekly Recap: FTC plans UniFirst deal suit and merger aims to cut costs
– UniFirst/Cintas spread narrows on report FTC hasn't indicated it will block deal (update)
See more updates in real-time with our News Flow.
– The Beauty Behind 'Boring' Stocks During Market Volatility
– Weekly Recap: FTC plans UniFirst deal suit and merger aims to cut costs
– UniFirst/Cintas spread narrows on report FTC hasn't indicated it will block deal (update)
See more updates in real-time with our News Flow.
Cintas Corporation is scheduled to release its next earnings report on Dec 17, 2026.
Why it matters:
– Key event: Earnings often drive significant price moves
– Market expectations: Traders watch revenue, EPS, and guidance vs forecasts
– Volatility spike: Price swings can increase before and after the release
How to use it:
– Track upcoming reports in the Earnings Calendar
– Compare actual results with analyst estimates
– Monitor price reaction and volume on Supercharts
Why it matters:
– Key event: Earnings often drive significant price moves
– Market expectations: Traders watch revenue, EPS, and guidance vs forecasts
– Volatility spike: Price swings can increase before and after the release
How to use it:
– Track upcoming reports in the Earnings Calendar
– Compare actual results with analyst estimates
– Monitor price reaction and volume on Supercharts
CIT stock is 0.00% volatile and has beta coefficient of 0.24.
What it means:
– Volatility: Shows how much the price fluctuates over time
– Beta > 1: More volatile than the market
– Beta < 1: Less volatile, more stable
Important to know:
– Volatility can increase during earnings, news events, or market stress
– Large-cap stocks like CIT are typically less volatile than smaller companies
Track every detail on Cintas Corporation stock chart and check out the list of the most volatile stocks — is Cintas Corporation there?
What it means:
– Volatility: Shows how much the price fluctuates over time
– Beta > 1: More volatile than the market
– Beta < 1: Less volatile, more stable
Important to know:
– Volatility can increase during earnings, news events, or market stress
– Large-cap stocks like CIT are typically less volatile than smaller companies
Track every detail on Cintas Corporation stock chart and check out the list of the most volatile stocks — is Cintas Corporation there?
To understand the CIT stock performance, it's worth checking price changes for various periods to get the full picture:
– 1 day — 0.00%
– 1 week — −0.65%
– 1 month — +11.17%
CIT all-time low was 17.16 EUR (Jan 23, 2015), and its highest price is 218.40 EUR (Nov 27, 2024). Find more dynamics in the Stock Heatmap and on the Cintas Corporation stock chart.
– 1 day — 0.00%
– 1 week — −0.65%
– 1 month — +11.17%
CIT all-time low was 17.16 EUR (Jan 23, 2015), and its highest price is 218.40 EUR (Nov 27, 2024). Find more dynamics in the Stock Heatmap and on the Cintas Corporation stock chart.
Cintas Corporation market capitalization is 78.68 B, representing the total value of all its outstanding shares (price × shares outstanding).
What it means:
– Market cap is one of the key ways to classify companies (large-cap, mid-cap, etc.)
– It reflects how investors value the company today
– It changes constantly with stock price movements
What to look at next:
– Market cap trends: Rising cap may signal growth and investor confidence; falling cap can reflect risk or downturns
– Price vs shares: Changes can come from Cintas Corporation stock price moves or share count (buybacks, issuance)
– Valuation ratios: Compare market cap with revenue and earnings
– Peer comparison: See how Cintas Corporation stacks up against other companies
What it means:
– Market cap is one of the key ways to classify companies (large-cap, mid-cap, etc.)
– It reflects how investors value the company today
– It changes constantly with stock price movements
What to look at next:
– Market cap trends: Rising cap may signal growth and investor confidence; falling cap can reflect risk or downturns
– Price vs shares: Changes can come from Cintas Corporation stock price moves or share count (buybacks, issuance)
– Valuation ratios: Compare market cap with revenue and earnings
– Peer comparison: See how Cintas Corporation stacks up against other companies
The safest way to buy Cintas Corporation stocks is through a reliable broker. Create an account, fund it, and place a buy order.
You can trade CIT directly from TradingView:
– Choose a broker: Explore our supported trading partners and pick one that fits your needs
– Compare options: View available brokers side by side to evaluate fees and features
– Connect your account: Open Supercharts, click “Trade”, select your broker, and log in
– Start trading: Place orders without leaving the chart
Tip: If you’re new to trading, try paper trading first — it lets you practice strategies in real market conditions without risking funds.
You can trade CIT directly from TradingView:
– Choose a broker: Explore our supported trading partners and pick one that fits your needs
– Compare options: View available brokers side by side to evaluate fees and features
– Connect your account: Open Supercharts, click “Trade”, select your broker, and log in
– Start trading: Place orders without leaving the chart
Tip: If you’re new to trading, try paper trading first — it lets you practice strategies in real market conditions without risking funds.
As of Nov 10, 2026, the company has 48.1 K employees.
Why traders follow this data:
– Company scale: Employee count reflects the size and global reach of the business
– Operational footprint: Higher headcount often indicates broader product lines, retail presence, or services
– Trend signal: Changes over time can reflect hiring growth, restructuring, or efficiency improvements
See our rating of the largest employers to find more opportunities.
Why traders follow this data:
– Company scale: Employee count reflects the size and global reach of the business
– Operational footprint: Higher headcount often indicates broader product lines, retail presence, or services
– Trend signal: Changes over time can reflect hiring growth, restructuring, or efficiency improvements
See our rating of the largest employers to find more opportunities.
Cintas Corporation pays dividends, but whether it is a “good” dividend stock depends on its yield and stability rather than dividends alone.
Its recent dividend yield was around 1.05%, with a payout ratio of 36.67%, compared to 0.69% and 35.44% in the previous period.
What to look at when looking for good dividend stocks:
– Dividend yield: Income potential relative to price
– Payout ratio: Sustainability of dividend payments
– Dividend history: Consistency and growth over time
– Earnings strength: Dividends are more reliable when supported by stable profits
– Total return: Combines dividends with stock price performance
Explore all this in Cintas Corporation financials.
Its recent dividend yield was around 1.05%, with a payout ratio of 36.67%, compared to 0.69% and 35.44% in the previous period.
What to look at when looking for good dividend stocks:
– Dividend yield: Income potential relative to price
– Payout ratio: Sustainability of dividend payments
– Dividend history: Consistency and growth over time
– Earnings strength: Dividends are more reliable when supported by stable profits
– Total return: Combines dividends with stock price performance
Explore all this in Cintas Corporation financials.
Investing in Cintas Corporation depends on your goals, risk tolerance, and market conditions. It’s essential to analyze the stock before making a decision.
First, study Cintas Corporation financials and track their dynamics on the Fundamental Graphs:
– Business fundamentals: Revenue, earnings, and growth trends
– Valuation: P/E ratio, market cap, and how it compares to peers
– Profitability: Margins, return on equity, and cash flow
– Dividends (if any): Yield, payout ratio, and consistency
Then explore our CIT technicals – signals based on essential indicators calculations:
– Today — buy
– 1-week — buy
– 1-month — strong buy
Combine fundamental and technical analysis for better results.
First, study Cintas Corporation financials and track their dynamics on the Fundamental Graphs:
– Business fundamentals: Revenue, earnings, and growth trends
– Valuation: P/E ratio, market cap, and how it compares to peers
– Profitability: Margins, return on equity, and cash flow
– Dividends (if any): Yield, payout ratio, and consistency
Then explore our CIT technicals – signals based on essential indicators calculations:
– Today — buy
– 1-week — buy
– 1-month — strong buy
Combine fundamental and technical analysis for better results.
Cintas Corporation stock ticker depends on the exchange where it’s listed. On the NASDAQ, its primary exchange, Cintas Corporation stocks trade under the symbol CTAS.
About tickers:
– Unique identifiers: A ticker is a short code used to find and trade a stock
– Exchange-specific: The same company may have different tickers across exchanges
– Search shortcut: Used on trading platforms, charts, and screeners
Remember:
– Some companies have multiple listings
– Always check the exchange prefix to avoid confusion
Learn how to find your desired assets in our Symbol Search.
About tickers:
– Unique identifiers: A ticker is a short code used to find and trade a stock
– Exchange-specific: The same company may have different tickers across exchanges
– Search shortcut: Used on trading platforms, charts, and screeners
Remember:
– Some companies have multiple listings
– Always check the exchange prefix to avoid confusion
Learn how to find your desired assets in our Symbol Search.
CIT earnings for the last quarter are 1.20 EUR per share, whereas the estimation was 1.17 EUR, resulting in a 2.59% surprise. The estimated earnings for the next quarter are 1.22 EUR per share.
How to read financials:
– Compare actual vs estimates: Earnings beats or misses often drive price moves
– Watch market reaction: Price response matters as much as the numbers
– Look at forward guidance: Future estimates signal expected growth
– Track trends: Analyze results across multiple quarters, not just one
Follow other essential metrics in Cintas Corporation financials:
– Revenue growth: Shows business expansion
– Margins (operating, net): Reflect profitability and efficiency
– Free cash flow: Indicates real cash generation
– Debt levels: Impacts financial stability and risk
How to read financials:
– Compare actual vs estimates: Earnings beats or misses often drive price moves
– Watch market reaction: Price response matters as much as the numbers
– Look at forward guidance: Future estimates signal expected growth
– Track trends: Analyze results across multiple quarters, not just one
Follow other essential metrics in Cintas Corporation financials:
– Revenue growth: Shows business expansion
– Margins (operating, net): Reflect profitability and efficiency
– Free cash flow: Indicates real cash generation
– Debt levels: Impacts financial stability and risk
Cintas Corporation revenue for the last quarter amounts to 2.59 B EUR despite the estimated figure of 2.57 B EUR. In the next quarter revenue is expected to reach 2.70 B EUR.
How to read this data:
– Compare actual vs estimates: Revenue beats or misses can move the stock
– Watch market reaction: Price response shows how investors interpret results
– Look at growth: Compare with previous quarters and year-over-year data
– Track trends: One quarter matters less than consistent performance
Follow other essential metrics in Cintas Corporation financials:
– Earnings (EPS): Profitability per share
– Margins (gross, operating): Efficiency and cost control
– Free cash flow: Cash available after expenses
How to read this data:
– Compare actual vs estimates: Revenue beats or misses can move the stock
– Watch market reaction: Price response shows how investors interpret results
– Look at growth: Compare with previous quarters and year-over-year data
– Track trends: One quarter matters less than consistent performance
Follow other essential metrics in Cintas Corporation financials:
– Earnings (EPS): Profitability per share
– Margins (gross, operating): Efficiency and cost control
– Free cash flow: Cash available after expenses
Yes, you can track Cintas Corporation financials in yearly and quarterly reports right on TradingView.
Use our Earnings Calendar to never miss important releases and spot opportunities early.
CIT net income for the last quarter is 473.50 M EUR, while the quarter before that showed 436.95 M EUR of net income which accounts for 8.37% change.
How to read this data:
– Track changes: Compare net income across quarters to spot trends
– Watch expectations: Compare with estimates to gauge performance
– Check margins: Net income reflects profitability after all expenses
– Look beyond one quarter: Consistency matters more than a single result
Follow other essential metrics in Cintas Corporation financials:
– Revenue: Overall business growth
– Earnings per share: Rising EPS over time often points to improving business performance
– Margins (gross, operating): Efficiency and cost control
How to read this data:
– Track changes: Compare net income across quarters to spot trends
– Watch expectations: Compare with estimates to gauge performance
– Check margins: Net income reflects profitability after all expenses
– Look beyond one quarter: Consistency matters more than a single result
Follow other essential metrics in Cintas Corporation financials:
– Revenue: Overall business growth
– Earnings per share: Rising EPS over time often points to improving business performance
– Margins (gross, operating): Efficiency and cost control
Cintas Corporation does pay dividends, which are distributed quarterly. The most recent dividend per share was 0.45 EUR, with a trailing twelve-month (TTM) dividend yield of 0.84%.
Explore more details on Cintas Corporation dividends, look at:
– Dividend history: Check whether payouts are growing, stable, or declining
– Payout ratio: How much of earnings are paid out as dividends
– Total return: Combine price growth + dividends for full performance view
Explore more details on Cintas Corporation dividends, look at:
– Dividend history: Check whether payouts are growing, stable, or declining
– Payout ratio: How much of earnings are paid out as dividends
– Total return: Combine price growth + dividends for full performance view
CIT reached its all-time high of 218.40 EUR on Nov 27, 2024. Its all-time low was 17.16 EUR and was reached on Jan 23, 2015.
Explore the Cintas Corporation stock price chart to see more price history, and discover companies reaching new all-time highs and lows.
Cintas Corporation EBITDA is 2.79 B EUR, with an EBITDA margin of 27.83%.
EBITDA is a measure of core operating performance, showing how much profit the company generates from its main business activities before accounting for financing and accounting-related costs.
What it means:
– Operating strength: Helps assess profitability from core operations
– Efficiency signal: Rising EBITDA often reflects improving business performance
– Comparability: Useful for comparing companies with different capital structures
What to look at next in Cintas Corporation statements:
– Revenue growth: Shows whether the business is expanding
– Net income: Captures full profitability after all expenses
– Free cash flow: Shows actual cash generated
– Debt levels: Important when evaluating earnings quality
EBITDA is a measure of core operating performance, showing how much profit the company generates from its main business activities before accounting for financing and accounting-related costs.
What it means:
– Operating strength: Helps assess profitability from core operations
– Efficiency signal: Rising EBITDA often reflects improving business performance
– Comparability: Useful for comparing companies with different capital structures
What to look at next in Cintas Corporation statements:
– Revenue growth: Shows whether the business is expanding
– Net income: Captures full profitability after all expenses
– Free cash flow: Shows actual cash generated
– Debt levels: Important when evaluating earnings quality
Analyst forecasts suggest a price range between 162.27 EUR and 224.12 EUR for CIT, based on current estimates.
Remember:
– Forecasts show possible scenarios, not guaranteed outcomes
– They're based on multiple analysts’ models and assumptions
– Target prices change with earnings, news, and market conditions
Don't rely on analysts' opinions alone:
– Use technical analysis: Trend, support/resistance, momentum
– Study fundamentals: Revenue, earnings, margins
– Account for market context: News, macro trends, sector performance
Remember:
– Forecasts show possible scenarios, not guaranteed outcomes
– They're based on multiple analysts’ models and assumptions
– Target prices change with earnings, news, and market conditions
Don't rely on analysts' opinions alone:
– Use technical analysis: Trend, support/resistance, momentum
– Study fundamentals: Revenue, earnings, margins
– Account for market context: News, macro trends, sector performance