PRFT - Broadening Wedge TopTop Structure
Moving price down to the lower line of the wedge, Breaking the dominant strongest uptrend
This breakdown may finish here or continue downward
2.64EUR
89.63 MEUR
821.34 MEUR
34.20 M
About PERFICIENT INC
Sector
Industry
CEO
Thomas J. Hogan
Website
Headquarters
St. Louis
Employees (FY)
6.55 K
Founded
1998
ISIN
US71375U1016
Perficient, Inc. engages in the provision of digital consultancy services. It provides services primarily to healthcare, financial services, manufacturing, automotive, communications, media and technology, consumer markets, and energy and utilities markets. It operates through the following geographical segments: United States, India, and Other Countries. The company was founded in 1998 and is headquartered in Saint Louis, MO.

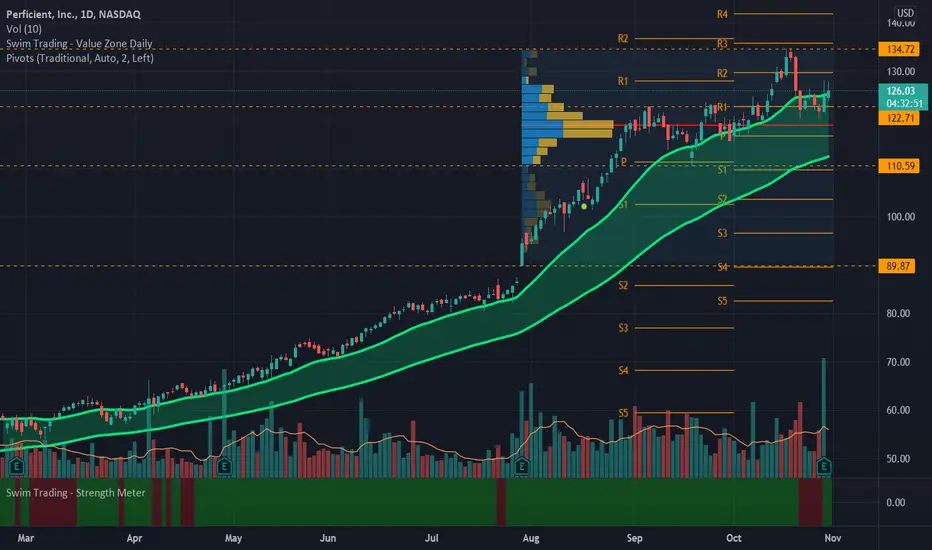
PRFT.NAS_Swim Trading VZ Breakout Trade_LongENTRY: 125.18
SL: 112.31
TP1: 137
TP2: 141
- ADX<20. Would like to be higher.
- RSI>50, <70
- Maintaining well at pivot point "R1".
- Entry based on breakout from VZ today.
- Strength meter shows strength.
- Currently above HVN.
PRFT offering another entry before shooting higher!* Excellent earnings
* Very strong up trend
* High RS in the Tech sector
* Testing broken resistance as support of a ~2 month consolidation
* Very high volume (178.3% higher than average)
Trade Idea:
* Usually when a stock breaks out, comes down and offers another entry it means it's ready to go hi

PRFT looking to go higher?* Excellent earnings year-over-year
* Very strong up trend
* Breaking out of a month long consolidation with higher than average volume
* Very high relative strength in the tech sector


Perficient trending nicely, but needs a pullbackPerficient, Inc. provides digital consultancy services and solutions in the United States and has been one of the steadier gainers over the last 12 months.
RSI says too expensive at the moment, so I have set an alert for when it crosses back below 65 to start looking for a potential entry.
One fo

5 Clear Technical Reasons to Buy PRFT (Perficient Inc)
(1) Ascending Triangle Pattern
(2)The candlestick closed more than 5% of the daily session.
(3) Near 70% of the apex of the ascending triangle.
(4) Upward sloping living averages.
(5) Stronger volume moving out of the
(6) Clear trend

$PRFT - curling upProfiling this stock shows potential for up to 27% gains (over 47 days).
I am watching it closely for making a W pattern. I would enter in the bottom of the last leg of the W.


See all ideas
Trade directly on the supercharts through our supported, fully-verified and user-reviewed brokers.


Frequently Asked Questions
The current price of PFS is 41.20 EUR — it has decreased by 1.90% in the past 24 hours.
Depending on the exchange, the stock ticker may vary. For instance, on GETTEX exchange PERFICIENT INC stocks are traded under the ticker PFS.
PERFICIENT INC is going to release the next earnings report on Apr 25, 2024. Keep track of upcoming events with our Earnings Calendar.
PFS stock is 2.44% volatile and has beta coefficient of 1.83. Check out the list of the most volatile stocks — is PERFICIENT INC there?
One year price forecast for PERFICIENT INC has a max estimate of 71.98 EUR and a min estimate of 59.98 EUR.
PFS earnings for the last quarter are 0.87 EUR whereas the estimation was 0.87 EUR which accounts for 0.30% surprise. Estimated earnings for the next quarter are 0.91 EUR. See more details about PERFICIENT INC earnings.
PERFICIENT INC revenue for the last quarter amounts to 211.18 M EUR despite the estimated figure of 210.00 M EUR. In the next quarter revenue is expected to reach 202.65 M EUR.
Yes, you can track PERFICIENT INC financials in yearly and quarterly reports right on TradingView.
PFS stock has fallen by 13.81% compared to the previous week, the month change is a 26.22% fall, over the last year PERFICIENT INC has showed a 35.16% decrease.
PFS net income for the last quarter is 21.00 M EUR, while the quarter before that showed 21.38 M EUR of net income which accounts for −1.77% change. Track more PERFICIENT INC financial stats to get the full picture.
Today PERFICIENT INC has the market capitalization of 1.46 B, it has decreased by 7.51% over the last week.
No, PFS doesn't pay any dividends to its shareholders. But don't worry, we've prepared a list of high-dividend stocks for you.
Like other stocks, PFS shares are traded on stock exchanges, e.g. Nasdaq, Nyse, Euronext, and the easiest way to buy them is through an online stock broker. To do this, you need to open an account and follow a broker's procedures, then start trading. You can trade PERFICIENT INC stock right from TradingView charts — choose your broker and connect to your account.
As of Apr 18, 2024, the company has 6.55 K employees. See our rating of the largest employees — is PERFICIENT INC on this list?
Investing in stocks requires a comprehensive research: you should carefully study all the available data, e.g. company's financials, related news, and its technical analysis. So PERFICIENT INC technincal analysis shows the sell today, and its 1 week rating is strong sell. Since market conditions are prone to changes, it's worth looking a bit further into the future — according to the 1 month rating PERFICIENT INC stock shows the strong sell signal. See more of PERFICIENT INC technicals for a more comprehensive analysis.
If you're still not sure, try looking for inspiration in our curated watchlists.
If you're still not sure, try looking for inspiration in our curated watchlists.
We've gathered analysts' opinions on PERFICIENT INC future price: according to them, PFS price has a max estimate of 71.98 EUR and a min estimate of 59.98 EUR. Read a more detailed PERFICIENT INC forecast: see what analysts think of PERFICIENT INC and suggest that you do with its stocks.
EBITDA measures a company's operating performance, its growth signifies an improvement in the efficiency of a company. PERFICIENT INC EBITDA is 146.33 M EUR, and current EBITDA margin is 17.82%. See more stats in PERFICIENT INC financial statements.