PLTR – Eyeing a Short-Term Push Into the 185–190 ZoneDescription
Been tracking PLTR’s short-term setup and the options flow is starting to paint a pretty clean picture.
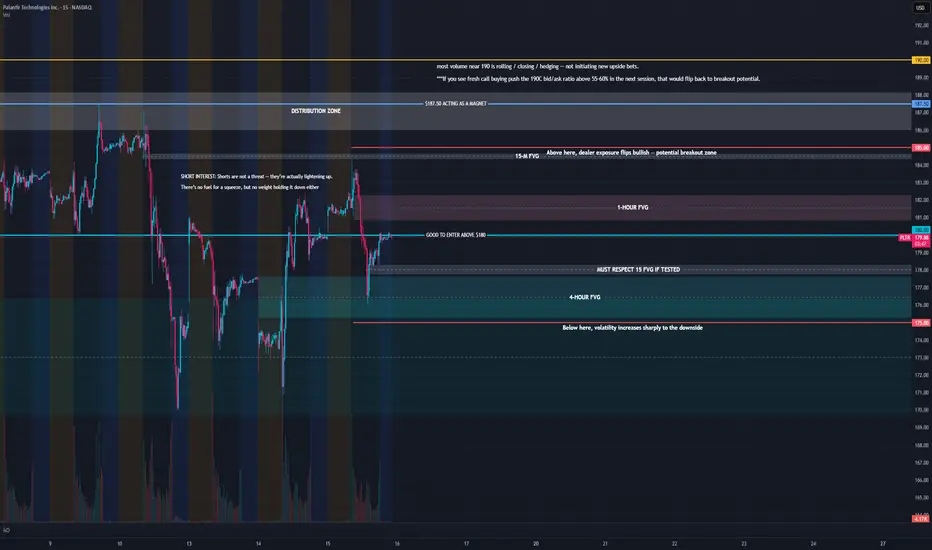
Most of the call interest for this week is stacked between $185–$195, with the heaviest concentration around $185–$190 — basically forming a near-term “gamma magnet.” Dealers tend to hedge long when price trades into that zone, which usually supports upside momentum rather than capping it.
Short interest sits around 2.3% of float, and the cost to borrow has stayed soft. That’s not a squeeze setup, but it’s enough to say there isn’t a heavy wall of short pressure right now. Meanwhile, the bid/ask ratios on the 195–200 calls are rising above 55–60%, showing traders are rolling exposure higher rather than closing out.
In short — we’re seeing a healthy rotation of call volume upward while the lower strikes (180–182.5) stay firm. That’s constructive for a potential 3–5 day continuation move.
My Plan:
Watching for a hold above $181–182 to stay in the bullish zone
If PLTR clears $185 with volume, expecting momentum to build toward $188–$190
Planning to take partials there — could stretch to $192 if the OI at 195–200 keeps growing
Cut below $179.50 if it loses call wall support
This isn’t a “rip your face off” squeeze setup — it’s more of a steady gamma-fueled drift higher while dealers stay long hedged.
Trade ideas
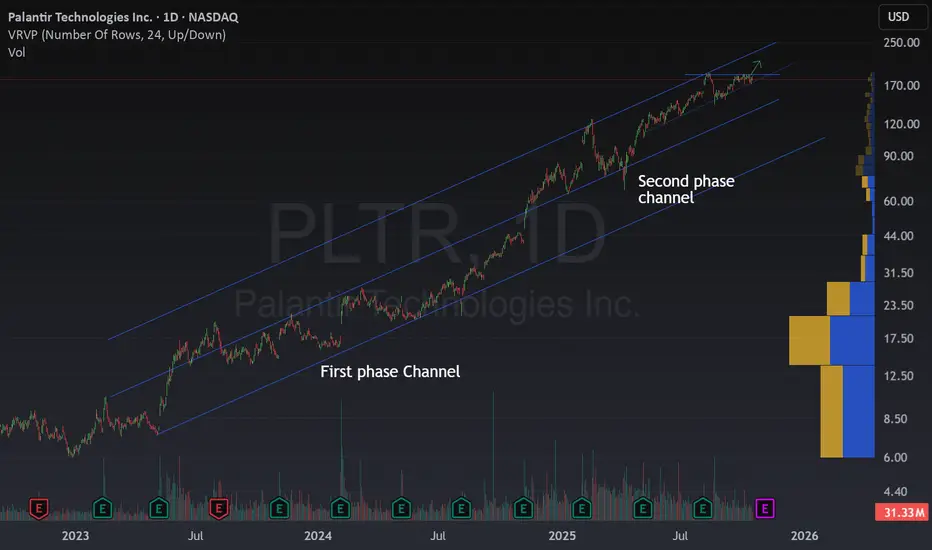
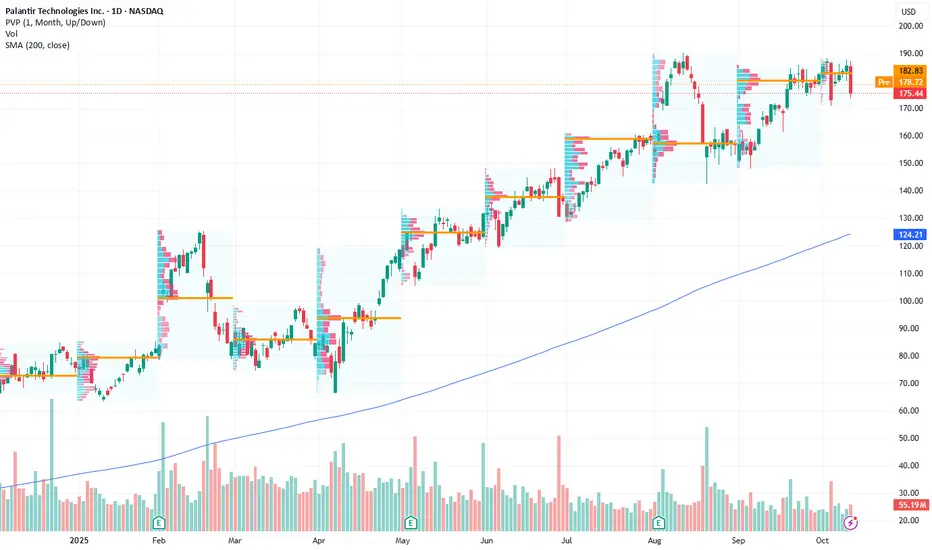
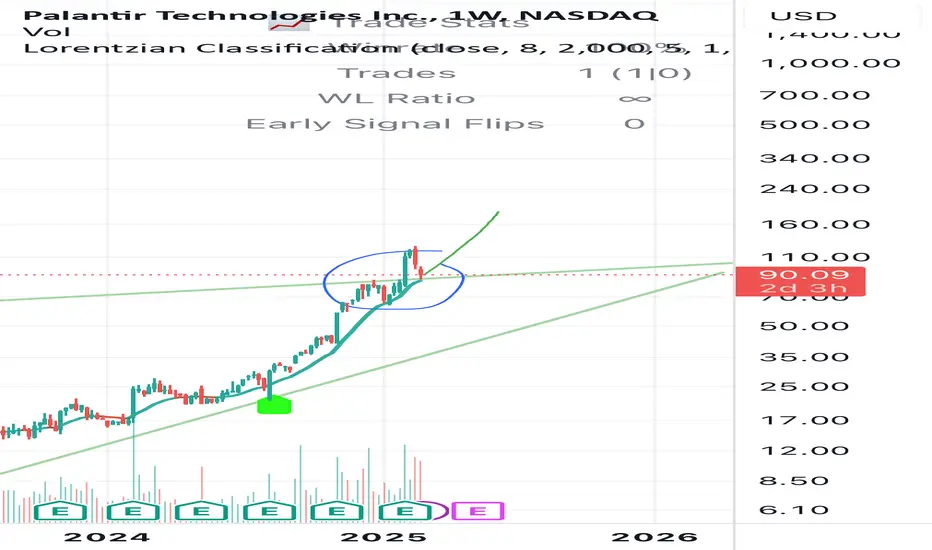
Palantir is Riding a Perfect Uptrend ChannelPalantir has been showing an impressive bullish trend lately.
What’s fascinating is how, from 2023 to 2024, it built a price channel, and after a strong rally, it continued respecting that same channel structure, with the same slope and rhythm, just at a higher price level.
As long as price remains inside this channel, I think the best move is to hold.
Right now, as Palantir approaches the mid-channel zone (blue dashed line) and faces a key resistance that could break soon, it looks like an interesting buy opportunity, if it confirms the breakout.
Several analysts, including Piper Sandler and BofA, have recently set price targets around $200, which aligns with the ongoing bullish momentum.
It’s a great way to join the Palantir rally, but with some caution if you’re holding long-term, it’s definitely running hot!
But… what isn’t these days? 😄
cup and handle. volume reducing adds to the cup and handle. this can go either way. catalyst needed. breakout needed

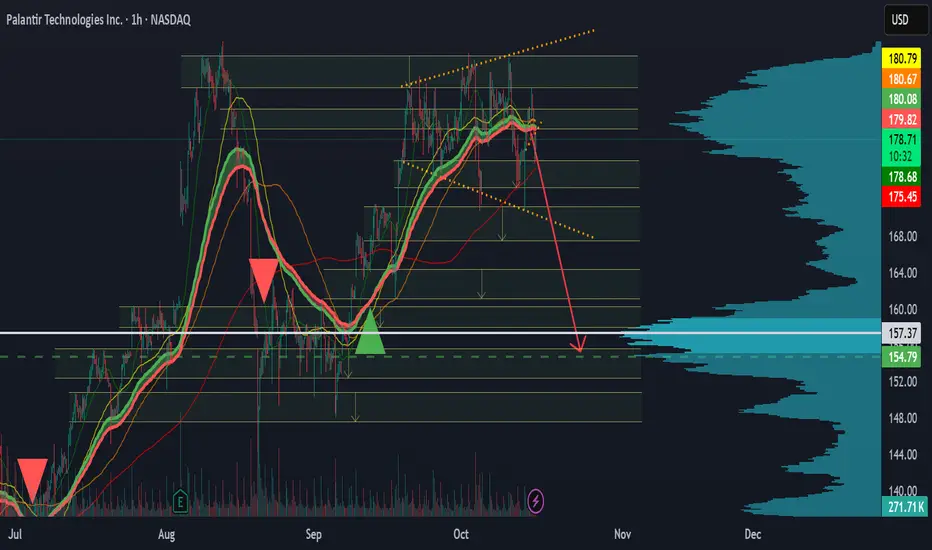
Palantir short ideaPalantir is showing weakness in its recent price action. The latest upward moves lack volume confirmation, suggesting reduced buying pressure. Price is consolidating below a key resistance level and the balance of demand and supply favors sellers. As long as price remains below this zone, a continuation lower toward 156 appears likely. Short position maintained with tight risk management.
⚠️ Not financial advice.
Bullish Momentum Signals $200+ Target Potential Current Price: $175.44
Direction: LONG
Targets:
- T1 = $185.00
- T2 = $200.00
Stop Levels:
- S1 = $170.00
- S2 = $165.00
**Wisdom of Professional Traders:**
This analysis synthesizes insights from thousands of professional traders and market experts, leveraging collective intelligence to identify high-probability trade setups. The wisdom of crowds principle suggests that aggregated market perspectives from experienced professionals often outperform individual forecasts, reducing cognitive biases and highlighting consensus opportunities in Palantir Technologies.
**Key Insights:**
Palantir Technologies has solidified its position as a leader in artificial intelligence and predictive analytics, which has become increasingly valuable for enterprises and government agencies across the world. With major tech partnerships, growing government contracts, and expanding use cases for its AI capabilities, Palantir is positioned to capitalize on the increasing demand for operational intelligence. Analysts have noted that the company’s focus on high-profit-margin contracts and niche sectors like defense and healthcare provides a protective moat against competition.
Furthermore, traders are highlighting technical catalysts. The recent breakout above the $170 resistance level has garnered attention, as institutional momentum buying suggests confidence in the stock’s upside potential. Additionally, the 50-day moving average has begun to converge with the 200-day moving average, creating a potential bullish golden cross pattern that reinforces confidence in the current uptrend.
**Recent Performance:**
Palantir's stock has seen remarkable growth over the past months, surging from a trading range near $150 at the start of Q3 to its current level near $175.44. This rally was supported by stronger-than-expected Q3 earnings reported last week, where management revealed a 25% year-on-year revenue increase and raised its full-year guidance for 2025, citing robust demand conditions. The stock’s recent ability to hold its gains above the psychologically significant $175 level suggests strong support from institutional buyers.
**Expert Analysis:**
Market experts are confident that Palantir is entering a new growth phase, driven largely by advancements in AI deployment and scalable solutions for commercial customers. The company’s projected revenue growth for Q4 2025 is expected to surpass 30%, a strong indicator of its operational soundness amid macroeconomic uncertainty. From a technical perspective, RSI levels are still trading below the overbought threshold, suggesting there’s room for continued upside momentum.
Experts also highlight Palantir’s institutional ownership levels nearing 60%, which could signal significant support for the stock’s price trajectory. Seasonal trends further suggest positive stock movement into Q4, as demand for its solutions rises during budget planning cycles for government agencies.
**News Impact:**
Recent news of increased U.S. Department of Defense contracts worth over $1 billion has been a significant positive driver for Palantir Technologies. With geopolitical tensions rising globally, defense agencies are prioritizing real-time data analytics and AI-powered capabilities, areas where Palantir has established itself as a trusted innovator. Additionally, the announcement of new initiatives with Fortune 500 companies signals accelerating adoption of Palantir’s products in the commercial sector, bolstering near-term and long-term revenue forecasts.
**Trading Recommendation:**
Palantir Technologies presents a compelling bullish opportunity for traders based on its strong earnings outlook, rising institutional support, and favorable technical indicators. Long positions taken at current levels ($175.44) appear well-supported by near-term catalysts and the broad macroeconomic tailwinds driving demand for AI and data analytics solutions. The target levels of $185.00 and $200.00 represent attainable short-term resistance zones based on current upward momentum, with stop-loss levels strategically set at $170.00 and $165.00 to manage downside risk effectively. Entering now enables traders to capitalize on further upside potential as Q4 unfolds.
Do you want to save hours every week? Register for the free weekly update in your language!
PLTR at a Critical Pivot. Oct. 13PLTR at a Critical Pivot: Will Smart Money Step In or Let It Slide?
Palantir got hit hard on Friday — down over 5%, closing near $175, as fear washed through the entire market. The stock followed the same downward rhythm as NVDA and TSLA, breaking below key trend levels before catching a late-session bounce. But the question now is: is this just a dead-cat move or a sign of smart money starting to accumulate?
Let’s break it down from both the 15-minute intraday structure and the 1-hour GEX setup, which gives us a real sense of how volatility and positioning could drive Monday’s move.
15-Minute Intraday Technical View
Friday’s chart shows a clean descending trendline, and PLTR is still trading beneath it. Each rally attempt last week was met with sharp rejection near the 179–180 zone, which now acts as the first ceiling to watch at the open.
That said, we’re seeing subtle but important signs of exhaustion in the selloff:
* MACD is flipping from deep red toward light blue bars — momentum is slowing.
* Stoch RSI has turned up from oversold territory, hovering around 30–40, suggesting short-term bullish potential.
The immediate support zone sits between 172 and 169. Buyers defended that range late Friday, forming a small higher low structure on the lower timeframe.
If PLTR holds this area and breaks above 177–179, it could trigger a quick relief run back toward 184–186, where heavy resistance sits along the upper channel.
But if PLTR fails to stay above 172, we could see another leg down toward 165, where the next support cluster lies — and possibly deeper toward 150 if the broader market remains under pressure.
Intraday traders should keep it simple:
* Above 179 → look for scalp longs toward 184–186.
* Below 172 → shorts open up back to 165–167.
This is a reactive, not predictive, setup day — let the price show strength before trusting a bounce.
1-Hour GEX Analysis — Options Sentiment
The options market is lining up tightly with the chart levels. The HVL (Highest Volatility Line) sits right around 177.5, which is almost exactly where PLTR stalled at the close. That level acts as a near-term pivot — reclaim it, and the pressure starts to ease; lose it, and volatility spikes again.
Above current price, there’s a clear cluster of Call Walls around 185, 190, and 195, meaning that’s where dealer resistance will kick in. These levels act as “gravity caps” for the stock unless implied volatility drops.
Below, we’ve got Put Walls stacked around 165 and 150, showing heavy downside hedging. The options flow still leans defensive with CALLS at 23.9%, confirming that traders remain cautious going into Monday.
IVR sits around 46.8, while IVX sits at 72.4 — both high but cooling slightly. This suggests volatility expansion may have peaked, leaving room for short-term relief moves if the market finds its footing.
From a GEX standpoint, PLTR is in negative gamma territory below 177, meaning dealers are selling into weakness. If the stock reclaims 180 and holds, gamma turns neutral, which could spark a quick momentum squeeze.
My Thoughts and Trade Ideas
PLTR is sitting right at the intersection of fear and opportunity. The downside momentum looks tired, and both MACD and Stoch RSI are hinting that sellers may be running out of fuel.
Still, this is a name that moves fast both ways — and Monday’s VIX behavior will decide the direction.
If volatility cools off early, PLTR could be one of the first tech names to bounce.
* For day traders, long above 178–180 with targets at 184–186, stops below 172.
* For option traders, consider 180C or 185C for a short-dated pop if SPY holds up.
* If the market opens weak and PLTR breaks 172, switch to 170P or 165P and let it ride — momentum will accelerate quickly in that scenario.
My bias: cautious bullish as long as PLTR stays above 172, bearish only if that floor breaks cleanly.
Final Take
PLTR is at a crossroads. The technicals suggest a possible intraday bounce, but the 1-hour GEX map shows strong overhead resistance.
It’s all about control — if buyers can reclaim 180, we could see a short-covering push into the 185–186 zone.
If not, it’s another trip down the ladder toward 165.
This week will separate patience from panic.
Disclaimer: This analysis is for educational purposes only and not financial advice. Always trade responsibly and follow your own plan.

Has PLTR formed the TOP?PLTR is struggling to breach the $190 levels since August 2025. With the current uncertainty and global tensions along with the stiff resistance of 190 levels, one may look for shorting opportunities in PLTR with targets of 170, 160 and 150. (For educational purposes only)

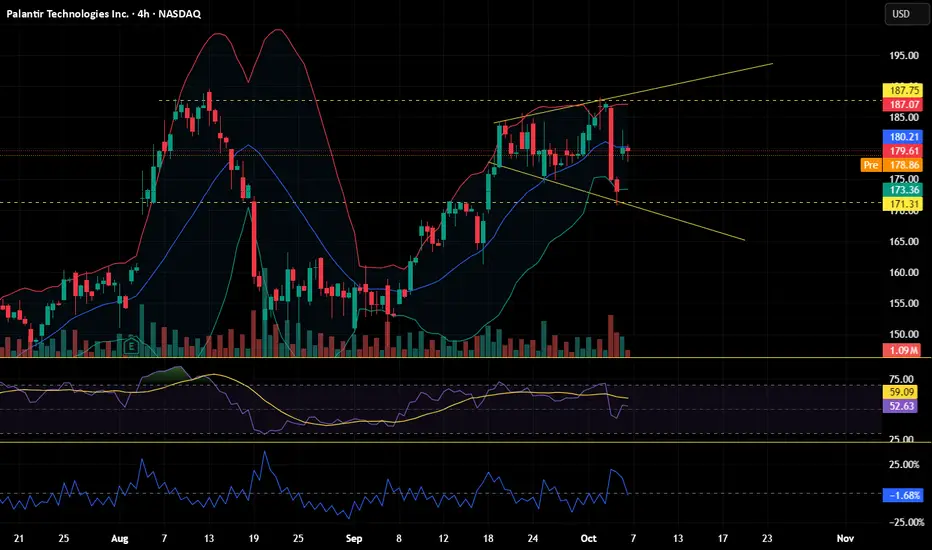
PLTR OCT 2025PLTR (4H) — Pullback into the rising trendline. First demand at 165–170 where ~$1.95B traded (potential absorption). Major distribution at 190, with ~$44B sold (weekly), capping rallies until reclaimed.
Upside targets
182–185
190 (then 195)
Downside targets
170
155–150
140–135
#PLTR #globaltrade #investment #investing #stockmarket #wealth #realestate #markets #economy #finance #money #forex #trading #price #business #currency #blockchain #crypto #cryptocurrency #airdrop #btc #ethereum #ico #altcoin #cryptonews #Bitcoin #ipo

How PLTR used to break double topsHave you noticed that when NASDAQ:PLTR makes double tops, it usually stays close to the breakout line without pulling back too far away?

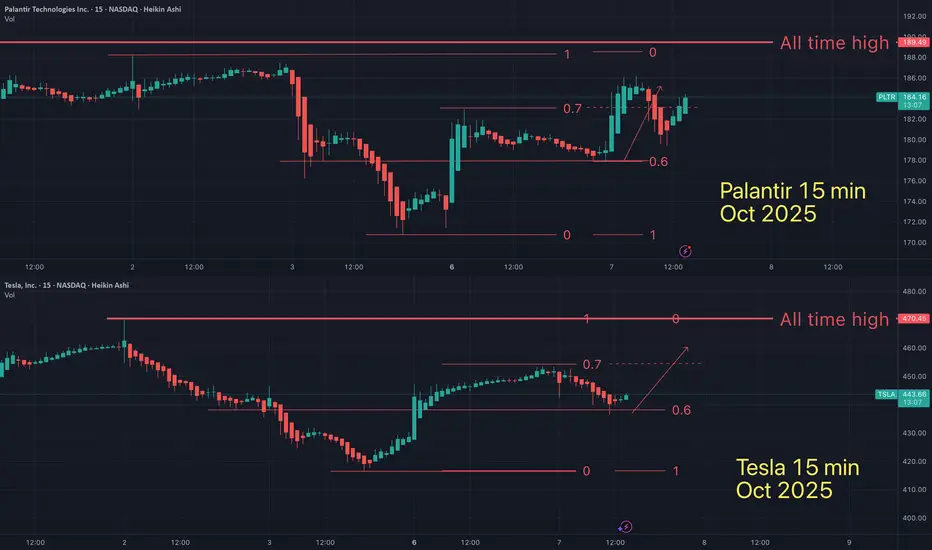
Here is the Palantir / Telsa Fractal on current 15 min timeframeFractals are a mathmatical anomaly, if you understand linear equations (and believe the market is "random"). All assets are doing the same patterns over and over, on all time frames. You just need to see it for what it is.
May the trends be with you.
expanding triangleas you see on the chart palantir is ranging in a expanding triangle pattern wich is not bearish or bullish.
but an expanding triangle stands for uncertainty in the markets, wich mostly turns bearish.
for palantir now its a bad time to step in, it would be to much of a gamble.
waiting for a breakout above to go long or a breakout down to go short would be the smartest move to make here
ANDREW «LEFT» GOES ANDREW «UP» AS PALANTIR CELEBRATES 5YRS ANNIVAndrew Left from "Citron Research" made his name writing shrewd short-seller reports on companies he deemed troublesome. In mid-August, Left called high-flying Palantir "overvalued".
Since that the stock turned down nearly 17% but resistently printed "Double Top" technical figure after. Now Left is excited about the bullish perspectives.
Palantir shares have jumped more than 1,700% since the data analytics company opened on the New York Stock Exchange 5 (five) years ago on Spetember 30, 2020.
During that time, revenue has roughly quadrupled as the company inked more deals with the U.S. government and benefitted from advancements in artificial intelligence.
Palantir’s steep valuation and reliance on government contracts have raised concerns.
The stock price has surged more than 1,700%, closing on Monday nearly at $180 for a market cap of over $430 billion. That puts it among the 20 most-valuable U.S. companies, and above tech stalwarts like Cisco and IBM.
Last year, Palantir joined the S&P 500, replacing American Airlines NASDAQ:AAL .
Quarterly revenue surpassed $1 billion for the first time last quarter, and is expected to reach $4.2 billion this year, according to analysts surveyed by LSEG, up almost sixfold from 2019. The company’s roster of customers grew from 125 in the first half of 2020 to 849 at the end of June. During that time, Palantir has added 1,500 full-time employees.
CEO Alex Karp, who founded the company in 2003 alongside notable investors like Peter Thiel and Joe Lonsdale, was exerting optimism on day one of Palantir’s life on the public market.
“We’ve reached a base where our company is very significant,” Karp, who holds a law degree from Stanford and PhD in neoclassical social theory from Goethe University in Frankfurt, Germany, told in an interview on listing day.
“Being in the public space will help us with our clients and help us grow.”
In a report in August 2025, Citron Research’s Andrew Left, a noted above ex-short-seller, called Palantir “detached from fundamentals and analysis.” When compared to OpenAI’s recent $500 billion valuation, he said Palantir should be priced at $40, or less than one-quarter of its current price, if it was assessed the same revenue multiple as the artificial intelligence startup.
“Karp and his team should be proud. But for investors, that’s where discipline kicks in,” Left wrote. “Comparison is the enemy of happiness, and when measured against true AI leaders, Palantir’s price already reflects success beyond its fundamentals.”
Karp, who doesn’t shy away from a dispute, recently told detractors to “exit” if they “don’t like the price.”
“We are going to be the most important software company in the world, and people will figure out what that’s valued over a long period of time,” Karp said on the day of the company’s NYSE debut.
For now, i.e. over the past 5 years since IPO debut, Palantir is among Top 3 S&P500 index performers, alltogether with Supermicro NASDAQ:SMCI (#1 rank) and Nvidia shares NVDA (#3 rank).
Over the past twelve months, Palantir stock has added nearly +350 %, and this is the 2nd return over all components, just after new kid on the block, Robinhood Markets NASDAQ:HOOD stock that entered S&P500 index earlier this year.
--
Best wishes,
@PandorraResearch Team

Is Palantir (PLTR) Entering a Consolidation Phase? A Technical aTechnical Analysis: Palantir Technologies (PLTR) Amid Overbought Signals and Valuation Gaps
Palantir Technologies Inc. (NASDAQ: PLTR) has experienced significant volatility in recent sessions, reflecting growing uncertainty among investors regarding its valuation and technical positioning. The stock closed at $173.07, down by 7.47%, after testing its resistance area near $186. Both daily and weekly technical indicators are now suggesting that a potential short-term correction could be underway.
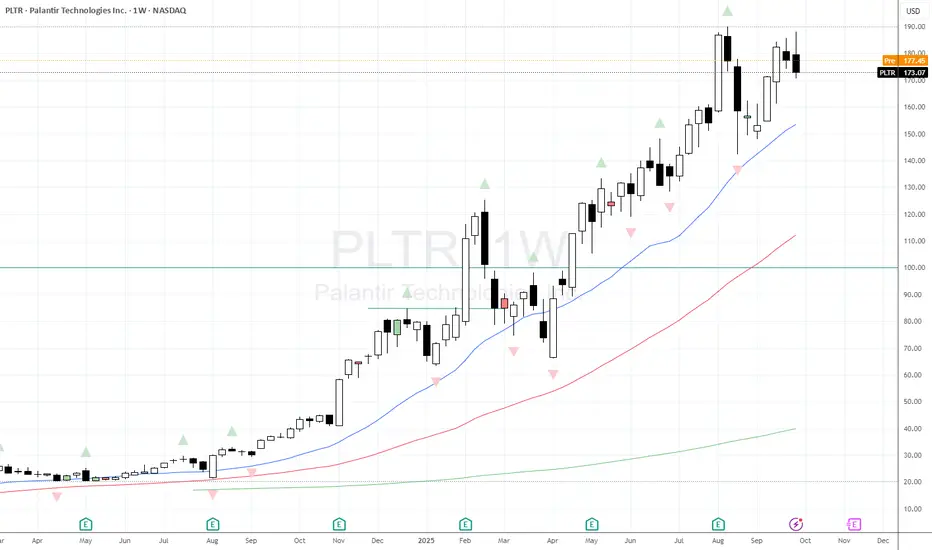
Weekly Chart Outlook: Approaching Resistance After a Prolonged Rally
From the weekly timeframe, NASDAQ:PLTR has been trending upward since early April, supported by consistent higher lows and strong momentum in the technology sector. The recent breakout above the $160–$165 zone confirmed bullish sentiment, but the latest candlestick formation shows rejection near $186, indicating profit-taking pressure.
The Stochastic RSI on the weekly chart is hovering in the overbought zone, signaling that the rally may be losing strength. While this does not necessarily imply an immediate reversal, it often precedes a consolidation phase or a short-term pullback. Volume patterns also show a slight decline compared to the early phase of the uptrend, reinforcing the possibility of slowing momentum.
Additionally, the price is now slightly extended from its key moving averages, suggesting that any correction toward the $160–$165 support zone would still maintain the longer-term bullish structure.
Daily Chart Confirmation: Stochastic RSI and MACD Turning Cautious
Read full analysis on my website :
darrismanresearch com

Palantir Money Heist – Breakout vs Pullback, Which Side Wins?💎🔫 PLTR Money Heist Plan – Thief Trader Edition 🚀
🎯 Asset: Palantir Technologies Inc. (PLTR)
🏦 Plan Type: Swing / Day Trade
⚡ Bias: Bullish (Pending Order Strategy)
🗺️ Thief Trader Heist Plan
Entry Zone (Breakout): 🔓 $162.00 ⚡
Pullback Entry: 🎯 $132.00 & above any price
🔔 Set TradingView alarms to catch the breakout easily — no excuses thieves!
Stop Loss (Breakout Entry): 🛑 $148.00
Stop Loss (Pullback Entry): 🛑 $120.00
📝 Stops are my thief levels — adjust based on your own strategy & risk.
Target: 💰 Escape vault before $184.00 – $188.00 resistance (Overbought + Trap Zone)
❓ Why This Plan? (Thief Logic)
Bullish Bias: Strong momentum around AI contracts & government adoption = upside fuel.
Breakout @162: Key resistance level tested multiple times → if broken, doors open for rapid move higher.
Pullback @132: Golden reload zone where buyers previously defended → sniper entry for risk/reward thieves.
Fear & Greed (75/100): Market greed creates volatility → perfect environment for quick thefts.
Macro Boost: AI sector tailwinds + gov contracts = solid catalysts.
Thief Rule: We don’t chase blindly — we wait for breakout confirmation or reload on pullback to maximize stolen pips.
📊 Palantir Stock Data Report (As of Sept 7, 2025)
Prev Close: $156.14
Day Change: -$3.03 (-1.94%)
After-Hours: $152.30 (-0.53%)
52-Week Range: $32.47 – $190.00 🎯
Market Cap: $363.23B 🏦
😱 Fear & Greed Sentiment
Retail Traders: 🟢 Bullish (70% optimism, AI hype + contracts)
Institutions: 🟡 Neutral (Valuation caution + competition risks)
Fear & Greed Score: 🔥 75/100 (Greed = volatility fuel)
💰 Fundamental Breakdown
Revenue (TTM): $3.44B
Net Income (TTM): $763.29M
Profit Margin: 22.18% ✅
P/E Ratio: 493.90 ⚠️ (Ultra high)
P/S Ratio: 112.41 (Overvalued vs peers)
Growth Drivers:
U.S. Commercial Rev ↑93% YoY 🚀
Gov Rev ↑49% YoY 🏛️
🌍 Macro & Market Drivers
🧠 AI Tailwinds: Massive global demand
🏛️ Gov Contracts: Potential expansion
⚔️ Competition: OpenAI + enterprise challengers
📊 Overall Market Score: 60/100 → Mildly Bullish 🐂
🔮 Key Takeaways (Thief Edition)
Short-Term: Expect heavy volatility (perfect for a thief’s quick grab).
Long-Term: Growth path strong but valuation = danger zone.
Watchlist: Q3 earnings (Nov 2025) + Gov contract headlines.
🔎 Related Assets to Watch
NASDAQ:META (AI sector peer)
NASDAQ:MSFT (Gov + AI contracts)
NASDAQ:NVDA (AI chip leader)
NASDAQ:TSLA (Speculative momentum)
AMEX:SPY (Macro market sentiment)
✨ “If you find value in my analysis, a 👍 and 🚀 boost is much appreciated — it helps me share more setups with the community!”
#PLTR #Palantir #AIStocks #SwingTrade #DayTrade #ThiefTrader #MoneyHeistPlan #StockMarket #TradingViewAnalysis

$PLTR Double top with Bearish Key ReversalPalantir has been in the news a lot recently, for a variety of reasons. However any trader/analyst has been happy following them for a good while.
Are we now about to take a pause? Is all that media attention having an impact on market sentiment?
Certainly last week we printed a bearish Key Reversal pattern, which was also the 2nd leg of a double top. Is price reflecting the sentiment?
key breakout zone as AI demand surges Current Price: $173.07
Direction: LONG
Targets:
- T1 = $181.50
- T2 = $191.00
Stop Levels:
- S1 = $167.50
- S2 = $161.00
**Wisdom of Professional Traders:**
This analysis synthesizes insights from thousands of professional traders and market experts, leveraging collective intelligence to identify high-probability trade setups. The wisdom of crowds principle highlights that the aggregated perspectives of seasoned traders can uncover overlooked opportunities. For Palantir Technologies, recent discussions emphasize its unique positioning within the rapidly growing AI sector and its high-margin government and enterprise contracts, which are widely recognized as long-term growth drivers in 2025 and beyond. Traders are consistently pointing toward Palantir’s ability to maintain profitability while simultaneously scaling its operations globally.
**Key Insights:**
As of 2025, Palantir Technologies has emerged as one of the leading "pure-play" AI software companies. Its focus is centered on advanced data analytics platforms, bolstered by its robust contracts with government agencies as well as Fortune 500 enterprises. Traders are particularly optimistic about Palantir's burgeoning foothold in AI-driven products, such as its AIP (Artificial Intelligence Platform), which has received strong reviews from clients integrating AI into critical operations. Recent rhetoric around the company's ability to leverage AI applications, defense dependability, and cybersecurity expertise suggests it is a clear beneficiary of ongoing global shifts toward automation and decision intelligence solutions.
Several analysts are also emphasizing the stock’s improving operating metrics—to this end, the company’s ability to outperform its guidance in Q2 and Q3 of 2025 signals positive underlying demand. The high free cash flow has been a key factor in convincing market participants of Palantir’s long-term viability.
**Recent Performance:**
Palantir Technologies has demonstrated strong relative strength recently, climbing more than 30% over the past three months as AI enthusiasm fuels increased institutional investment. After consolidating around the $160-$165 range earlier this year, its recent breakout through the $170 level underscores growing investor optimism. The current price action at $173.07 suggests further upside potential, especially as traders anticipate momentum heading into the holiday quarter. Volatility has remained manageable, and volume trends indicate accumulation by hedge funds and mutual funds.
**Expert Analysis:**
Technical analysts highlight that the $170 price level operates as a key support zone after breaking resistance earlier this quarter. The ascending triangle pattern forming over the past quarter suggests bullish continuation if the stock successfully holds above this level. RSI and MACD indicators also validate the positive momentum, with both trending upward since August.
Fundamentally, experts point to Palantir's expansion into high-value AI-powered platforms like the Artificial Intelligence Platform (AIP), which is reshaping how large-scale enterprises harness decision-making insights. The company's strategic focus on its profitability metrics during 2025 has been widely applauded, as it lays a strong foundation for revenue expansion over subsequent fiscal periods. Institutional investors are projecting robust forward P/E ratios relative to the broader tech sector.
**News Impact:**
Recent headlines surrounding government AI spending have been highly favorable for Palantir, with additional contracts from the U.S. Department of Defense and NATO allies regularly hitting the wire in 2025. Additionally, the firm’s recent announcement regarding a deeper partnership with Amazon Web Services for global cloud expansion has garnered immense attention, underscoring a strategy to cement partnerships with tech giants for scalability. The AI pivot, combined with its powerful relationships in both public and private sectors, continues to bolster confidence in the stock’s mid-term trajectory.
**Trading Recommendation:**
Given Palantir Technologies’ improving fundamentals, strong technical setup, and the increasing adoption of AI systems in both government and enterprise, a LONG position is recommended at the current price of $173.07. The first upside target of $181.50 reflects immediate resistance levels, while the secondary target of $191.00 aligns with further breakout potential over the next 2-3 months. Stops should be placed at $167.50 and $161.00, ensuring adequate risk management below key support levels. Increased accumulation by institutional investors, combined with favorable macro trends in AI adoption, suggests Palantir Technologies remains one of the most compelling tech plays of 2025.
Do you want to save hours every week? Register for the free weekly update in your language!

PLTR at a Crossroad: $162 Breakout or $144 Retest?
NASDAQ:PLTR The stock is consolidating around $158 after pulling back from the $188 high. Key zones and possible scenarios are highlighted:
Support levels:
$156–152 → nearest support
$144 → strong support
$126 → deeper support zone
Resistance levels:
$162–163 → breakout level to watch
$180–188 → upside target if momentum continues
Indicators:
Bollinger Bands are tightening → signaling a potential breakout.
MACD is curling upward after a bearish phase → early sign of a possible reversal.
Scenarios:
• 🟢 Bullish: breakout above $162 could open the way to $180–188.
• 🔴 Bearish: drop below $156 could push price towards $144.
Short-term moves may be strongly influenced by upcoming U.S. macro data (CPI & Fed expectations).

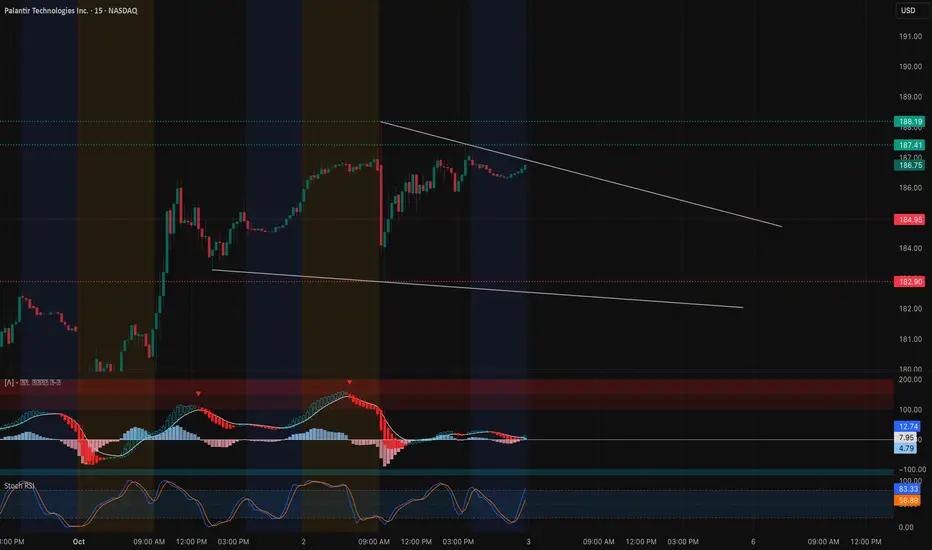
PLTR Testing the Breakout Zone – Big Gamma Cluster Ahead for OctIntraday Technical Outlook (15m Chart)
Palantir (PLTR) closed at $186.75, consolidating under a descending trendline after a strong run earlier this week. On the 15-minute chart, price is tightening into a wedge formation:
* MACD: Flattening near neutral after recent downside momentum, showing signs of a potential shift.
* Stoch RSI: Just bounced from mid-zone toward overbought, suggesting near-term strength if momentum holds.
* Key Levels: Resistance sits at $187.4–188.2, followed by $189.4. Support is at $185, with deeper downside near $183–182.9.
Intraday takeaway: PLTR needs to break above $188.2 for a clean breakout; otherwise, the wedge could force a pullback to $185.
Options Sentiment & GEX Outlook (1H Chart)
The GEX map highlights where institutional positioning could steer price action:
* Gamma Walls:
* $188–192.5: Heavy call wall cluster and highest positive GEX — major resistance zone.
* $185–182.5: Key support layers where dealer hedging may slow selling.
* $175 / $170: Large put walls that would act as magnets if downside momentum accelerates.
* Implications:
* Sustaining above $186.5–187 keeps price pinned toward the $188–190 gamma resistance zone.
* A rejection below $185 increases the risk of a pullback toward $182.5–180 before buyers reload.
* Volatility Context: IVR at 26 vs IVx avg 59.2 means premiums are slightly underpriced. With GEX tightly packed, directional breakouts could deliver outsized option moves.
My Thoughts & Recommendation
For Oct 3 trading, PLTR is sitting right at the breakout test:
* Intraday (scalping/trading): Bullish above $187.4 with targets at $188.2–189.5. Failure to break $188 risks fading back toward $185–183.
* Options trading (swing/0DTE): Calls make sense on confirmed breakout above $188, chasing toward $190–192. Puts become favorable if PLTR rejects $188 and slips back under $185, with $182.5 as the first magnet.
Bias heading into Oct 3: Bullish leaning, but only if $188 breaks cleanly.
Disclaimer:
This analysis is for educational purposes only and does not constitute financial advice. Always do your own research and manage risk before trading.
It will simply bounce off and go further up. Pltr super bullish.Lorenztian classification line. Bounces off at 60-80. Goes up again. Simply clear pattern.
Pltr super bullish.
Magic word - AI . Dont go against AI , especialy gov AI.
PLTR Breaking Into Supply – $186 Key Gamma Pivot (Oct 2) Intraday (15-Min Chart)
Palantir surged early but then stalled near the $185–$186 zone, where price is now consolidating. On the 15-min chart, price is moving along a rising trendline but momentum looks extended. MACD is still positive but fading, and Stoch RSI shows overbought conditions that may force short-term cooling.
* Immediate resistance: $186.2–$186.5 (intraday ceiling).
* Support zones: $183.3 (near-term pivot) and deeper at $178.5.
* Upside trigger: Breakout above $186.5 could squeeze toward 188.5–190 intraday.
* Downside risk: Rejection here sends price back to $183, with a deeper flush possible into $178.
Bias intraday: cautiously bullish above 183.3, but stretched oscillators suggest choppy consolidation unless bulls decisively break 186.5.
Options / GEX (1-Hour Chart)
Gamma structure gives a clear roadmap for PLTR’s next move:
* Call walls: Heavy levels sit at 187.5–192.5, with $192.5 marked as the 2nd call wall.
* Put walls: Support zones show up around 177.5 and further at 172.5, defining downside boundaries.
* Sentiment: Options flow is more balanced (≈40% calls), unlike TSLA/MSFT, suggesting less aggressive bullish pressure.
The highest positive GEX resistance is currently at $182.5, which PLTR has just cleared. This flip shifts dealer hedging into a supportive dynamic, meaning price could grind toward 187–190 as long as $183 holds.
My Thoughts
For Oct 2, PLTR is pressing into a pivotal resistance zone. If $186.5 breaks with volume, momentum could carry it into 188–190 quickly. If rejected, expect a retest of 183, and possibly a pullback toward $178 if weakness persists.
* Bullish play: $185/190 call spread targeting continuation toward gamma walls.
* Defensive play: Hedge under $183 with short-term puts, eyeing 178.
Bias: PLTR looks constructive above 183, but $186.5 is the true breakout line to watch.
Disclaimer: This analysis is for educational purposes only and does not constitute financial advice. Always do your own research and manage risk before trading.

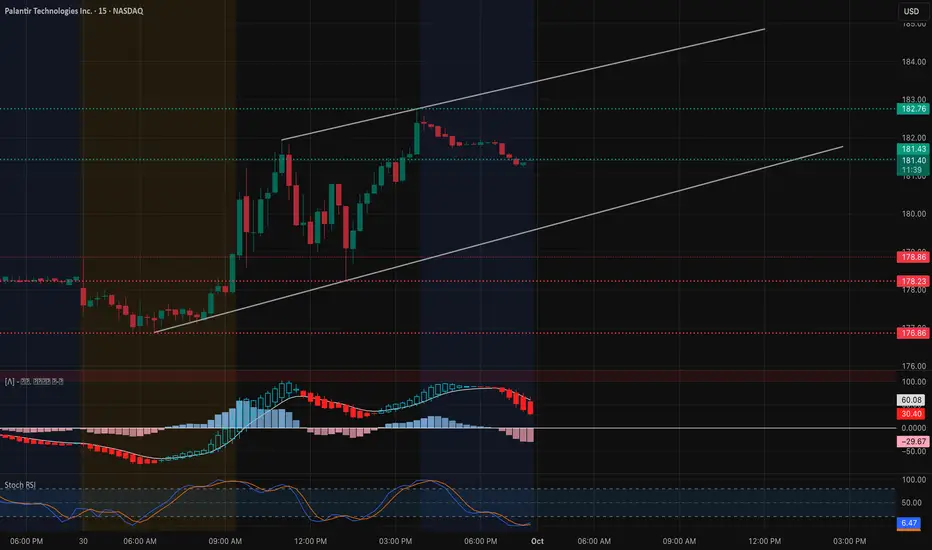
PLTR Oct. 1 – Testing the Top of the Range! 🚀Intraday View (15-Min Chart)
PLTR surged early but is now pulling back from $183 resistance, consolidating near $181 within an ascending channel. Momentum has cooled, with MACD rolling over and Stoch RSI slipping toward oversold.
* Support Levels: $181.40, $178.86, $177.48
* Resistance Levels: $182.76, $183.00
* Indicators: MACD showing bearish histogram build, Stoch RSI nearing bottom levels.
📌 Intraday Thought (Oct. 1): If $181 holds, PLTR could bounce back to retest $182.7–$183. A breakdown below $181 risks sliding to $178.5–$177.5. Scalpers can lean long near $181 support with stops just below, or fade strength near $183 resistance.
Options & Swing View (1H + GEX)
Gamma levels outline the battlefield:
* Upside: Strong call wall at $182.5–$187.5, with another stacked wall above $190.
* Downside: Key put support near $172.5–$170, with deeper protection at $162.5.
This paints a range between $177.5–$183 short term. A breakout over $183 could fuel a run toward $187.5–$190, while losing $177.5 risks momentum fading back to $172.
* Bullish Play (Oct. 1): Calls or spreads targeting $187.5–$190 if $183 breaks convincingly.
* Bearish Hedge: Short puts toward $177.5 → $172 if $181 support fails.
* Neutral Play: Iron condor between $177–$183 for range capture while PLTR churns sideways.
My Thoughts (Oct. 1)
PLTR is pressing into the upper end of its range again. The $183 level is the line in the sand—above it, we could see quick follow-through toward $187.5+. If it can’t clear $183, expect chop back toward $178. For now, I’d trade this as a range setup, but keep tight risk management if $183 breaks.
Disclaimer: This analysis is for educational purposes only and does not constitute financial advice. Always do your own research and manage risk before trading.
PLTR goes higherPrice just crushed the resistance with big volume slowly coming back in. Watch it make a new ATH

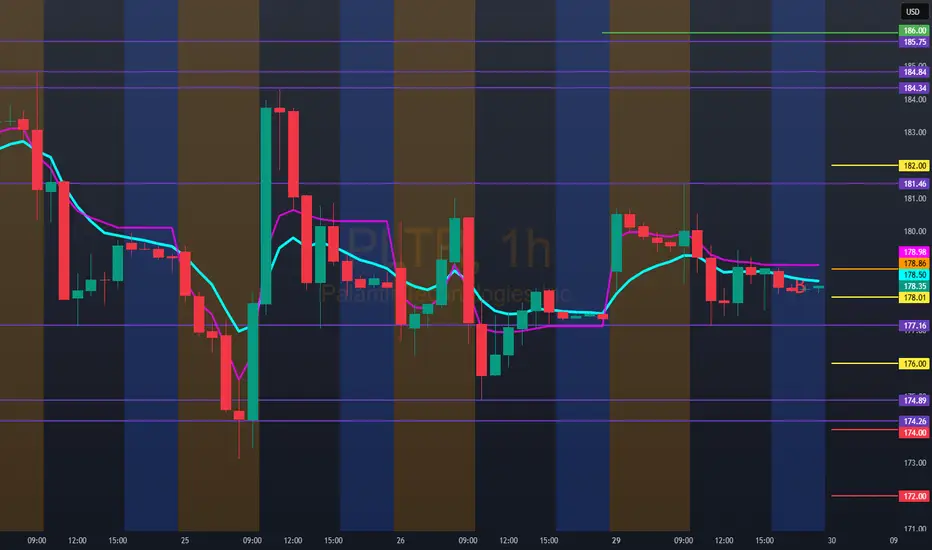
Hello trader, for tomorrow, 9/30/25, PLTR: 178.86If the open is above the closing price, we could enter a quick bullish position up to 182.00. If the movement continues, we could close the position at 184.00, forming a triple top. Our next bullish entry could be above 186.00. The price could also find a rejection zone at 182.00.
On a bearish entry, a rejection zone could be found at 176.00. If this price falls below 176.00, we only enter bearish below 174.00/172.00.