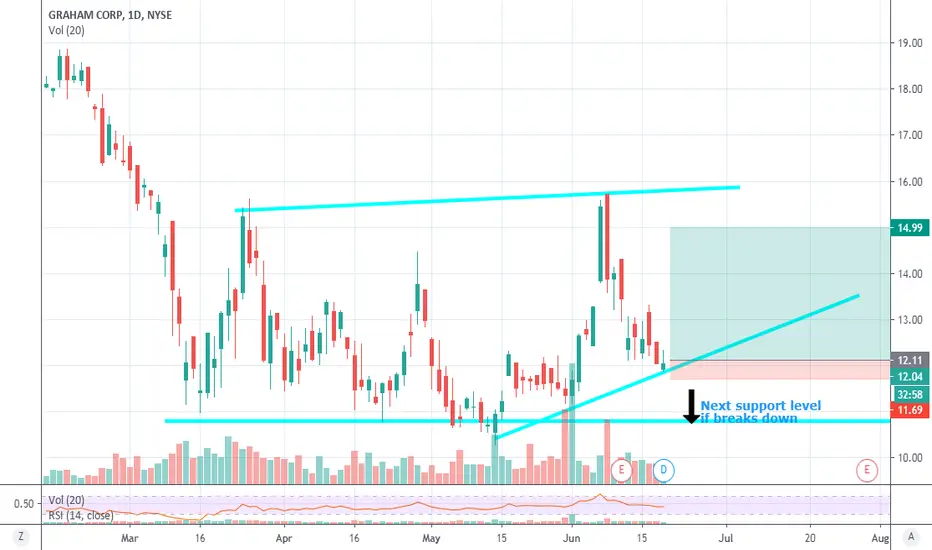
GHM, Good time for potential long entry Good odds,
Recent inside buying June 12 and June 16, not huge but consistent .
Low short float
Close to book value
Close to march 18th lows
Good EPS outlook
No debt
Entry 12.12
Stop 11.69
Target 14.99 (could go higher based on chart)
0.26USD
367.00 KUSD
157.12 MUSD
10.25 M
About Graham Corporation
Sector
Industry
CEO
Daniel J. Thoren
Website
Headquarters
Batavia
Employees (FY)
538
Founded
1983
ISIN
US3845561063
FIGI
BBG000BKB811
Graham Corp. engages in the business of designing and manufacturing mission critical fluid, power, heat transfer, and vacuum technologies for the defense, space, energy, and process industries. The company was founded on March 7, 1983 and is headquartered in Batavia, NY.

Trade directly on the supercharts through our supported, fully-verified and user-reviewed brokers.


Frequently Asked Questions
The current price of GHM is 29.55 USD — it has increased by 1.62% in the past 24 hours.
Depending on the exchange, the stock ticker may vary. For instance, on NYSE exchange Graham Corporation stocks are traded under the ticker GHM.
Graham Corporation is going to release the next earnings report on May 30, 2024. Keep track of upcoming events with our Earnings Calendar.
One year price forecast for Graham Corporation has a max estimate of 30.00 USD and a min estimate of 30.00 USD.
GHM earnings for the last quarter are 0.04 USD whereas the estimation was −0.05 USD which accounts for 188.89% surprise. Estimated earnings for the next quarter are −0.04 USD. See more details about Graham Corporation earnings.
Graham Corporation revenue for the last quarter amounts to 45.08 M USD despite the estimated figure of 41.93 M USD. In the next quarter revenue is expected to reach 38.94 M USD.
Yes, you can track Graham Corporation financials in yearly and quarterly reports right on TradingView.
Like other stocks, GHM shares are traded on stock exchanges, e.g. Nasdaq, Nyse, Euronext, and the easiest way to buy them is through an online stock broker. To do this, you need to open an account and follow a broker's procedures, then start trading. You can trade Graham Corporation stock right from TradingView charts — choose your broker and connect to your account.
As of Apr 16, 2024, the company has 538.00 employees. See our rating of the largest employees — is Graham Corporation on this list?
EBITDA measures a company's operating performance, its growth signifies an improvement in the efficiency of a company. Graham Corporation EBITDA is 10.70 M USD, and current EBITDA margin is 4.61%. See more stats in Graham Corporation financial statements.