XAUUSD (GOLD) I Firm Support Holding Above 4,000Welcome back! Let me know your thoughts in the comments!
** XAUUSD Analysis - Listen to video!
We recommend that you keep this on your watch list and enter when the entry criteria of your strategy is met.
Please support this idea with a LIKE and COMMENT if you find it useful and Click "Follow" on our profile if you'd like these trade ideas delivered straight to your email in the future.
Thanks for your continued support!
Trade ideas

Gold Market at turning point | target inside The Gold is running in the bullish trend, it can change the direction into the bearish when the price touch 4189 to 4211, then the price can fall till 4157.
If price breaks 4223, it can fly till 4247, if the price respects 4189 to 4211, it can give us more pips and we can see a big drop.
What's your idea about it.

XAUUSD - buy gold...XAUUSD was recently in a short term downtrend for a few weeks but has now shown some clear bullish movements ahead. XAUUSD (Gold) has broken out of a downward trend channel that was acting as strong resistance, The price is very likely to head to the next strong resistance level which is marked as the take profit zone (green line). Time to buy GOLD!

Gold next move (gold looks fragile)(24-11-2025)Go through the analysis carefully and do trade accordingly.
Anup 'BIAS for the day (24-11-2025)
Current price- 4075
"if Price stays below 4095, then next target is 4065, 4050 and 4025 and and above that 4100, 4115 ".
-POSSIBILITY-1
Wait (as geopolitical situation are worsening )
-POSSIBILITY-2
Wait (as geopolitical situation are worsening)
Best of luck
Never risk more than 1% of principal to follow any position.
Support us by liking and sharing the post.

Gold analysis and signalENTRY:4170 TO 4200
SL: 4238
TP: 4011
R/R=2.5
Be successful and profitable.
**Please observe capital management. There is no responsibility for your profit or loss.**

Recovery - Gold price continues to increase above 4200✍️ NOVA hello everyone, Let's comment on gold price next week from 12/01/2025 - 12/05/2025
⭐️GOLDEN INFORMATION:
Gold (XAU/USD) pulls back from its two-week high near $4,200 in early European trading on Friday, sliding toward the lower end of its intraday range. A firmer US Dollar—extending its rebound from a one-and-a-half-week low—combined with upbeat equity sentiment is redirecting flows away from the safe-haven metal.
⭐️Personal comments NOVA:
Gold prices continue to recover as December rate cut odds increase: heading towards resistance 4244, 4356
🔥 Technically:
Based on the resistance and support areas of the gold price according to the H4 frame, NOVA identifies the important key areas as follows:
Resistance: $4244, $4356
Support: $4145, $4089
🔥 NOTE:
Note: Nova wishes traders to manage their capital well
- take the number of lots that match your capital
- Takeprofit equal to 4-6% of capital account
- Stoplose equal to 2-3% of capital account
- The winner is the one who sticks with the market the longest

GOLD 1H Chart Technical AnalysisDear Traders,
Please also consider the important news events on the economic calendar, as they may significantly impact market volatility and price movement.
We are currently observing price consolidating between two key weighted levels, with an upside gap at 4156 and a downside gap at 4040. To identify the next directional range, we need to focus on these 2 scenario marked.
Price may continue to move sideways and retest these zones until one of the weighted levels decisively breaks and locks, which will confirm the direction for the next market leg. Refer to the arrows marked on the 1H timeframe, which highlight the two potential scenarios and assist with accurate entry timing.
Scenario 1 – Bullish Continuation
If price breaks the resistance and locks above 4155, we anticipate a continuation toward higher targets 4193 & 4233, supported by the bullish structure.
Scenario 2 – Support Test & Bounce
If price fails to lock above resistance, we expect a retracement toward the lower support zones at 4100 & 4060 for a potential support test and bounce.
We will keep both scenarios in mind as we continue taking buy entries from dips. Our updated weighted levels and structural zones will help us track any downward movement and position ourselves to capture upward bounces effectively.
As always, we will continue executing our dip-buying strategy, targeting 20–40 pips per entry. Each structural level consistently provides a 30–50 pip bounce, offering clean, high-probability entry and exit opportunities.
The Quantum Trading Mastery

GOLD VERY CLOSE TO BREAKING OUT VERSUS THE STOCK MARKET.Gold very close to breaking out vs stock market.
Lots of room left to outperform.

Gold XAUUSD buy?I was reluctant to post a gold set up but f*#k it!!
Scroll down to sell earlier entries...
Currently giving 1 person an opportunity to learn how I take these crazy entries and master the markets.
Comment on this post with why you deserve it, I will choose only 1.
Good luck.

THE KOG REPORTTHE KOG REPORT:
In last week’s KOG Report we gave the potential path as well as the red box defence to look for any reaction in price. We managed to support the lower red box defence giving us a nice long to start the week then resulting in the higher defence holding and giving us an extremely decent short. It was only during the later part of the week we faced some choppy and whipsawing ranging which we decided wasn’t worth committing too much into, so we returned to scalping the red boxes only for the remainder of the week.
A decent week in Camelot, not only on Gold but the numerous other pairs we trade and analyse.
So, what can we expect in the week ahead?
It’s likely to be another week of choppy price action and potential for a range to develop even smaller than we’ve seen in previous sessions. We have the key level of support below again at 4040 while resistance above sits at key level of 4104. Economic news on Tuesday should bring volume and we would expect one of these levels to break open and the range to have accumulated enough to then move us into a clear direction.
We have added the red box defence up and down, ideally wanting a test of that low, so price going up on the open could represent opportunities to attempt the short unless defence is breached. Otherwise, we’ll look to take this into that 4000-3980 levels before we look for any RIPs.
RED BOXES:
Break below 4060 for 4055, 4050, 4041, 4033 and 4010 in extension of the move
Break above 4081 for 4095, 4103, 4120 and 4130 in extension of the move
Please do support us by hitting the like button, leaving a comment, and giving us a follow. We’ve been doing this for a long time now providing traders with in-depth free analysis on Gold, so your likes and comments are very much appreciated.
As always, trade safe.
KOG

XAUUSD Next swing trade can be good in buy side if...If the price comes back to retest the demand zone and the trend line is respected recently, then we can plan a swing long trade with good RRR.
Note - Make sure you manage your risk management as every trade has the possibility to fail.

XAUUSD: Market Analysis and Strategy for November 25th.Gold Technical Analysis:
Daily Resistance: 4180, Support: 4000
4-Hour Resistance: 4155, Support: 4040
1-Hour Resistance: 4150, Support: 4100
Technically, the monthly chart maintains a strong upward trend, and the weekly chart indicates that bullish sentiment has persisted. 4040 is a key support level. After a significant rise, the daily chart suggests a continued bullish trend, with the Bollinger Bands expanding upwards and the moving averages moving higher. The 4000 support level has been confirmed and will likely provide strong support in the future. As mentioned in yesterday's analysis, "If gold recovers above 4085 in the short term, the upward trend can continue, with the 4140/4150 area to be watched again." This view has been confirmed, as 4150 has formed short-term resistance! Long-term holders can still wait for buying opportunities; the ideal long-term buying position for gold remains below 4000!
Looking at the 1-hour chart, gold rebounded after a decline in the European session. The Bollinger Bands are narrowing, and the candlestick pattern forms a rounded top, indicating a need to monitor the continuation of the downtrend. In the short term, the resistance level to watch remains around 4150.
Trading Strategy:
SELL: 4165~4170
BUY: 4097~4102
More Analysis →

GOLD ANALYSIS What’s Moving the Market Today? November 26, 2025OANDA:XAUUSD GOLD ANALYSIS What’s Moving the Market Today? (November 26, 2025)
Welcome back to Trade with DECRYPTERS, where we break complex smart-money charts into clean buy & sell zones.
Keep it simple let the levels guide your decisions.
*📰 Market Overview*
Gold continues to push higher inside the rising channel after reacting cleanly from the Smart Money Buy Orders (4088–4109).
A stronger USD earlier in the week capped upside, but buyers have stepped back in aggressively as volatility tightens.
The Dollar Index remains steady near the key 100.20 zone, limiting impulsive bullish continuation—but geopolitical uncertainty and central bank demand continue to provide a strong foundation underneath gold.
As we head deeper into the week, markets are bracing for delayed high-impact macro releases while positioning ahead of December’s FOMC event.
*🔍 Key Fundamentals Driving Today’s Move*
📈 DXY stable near 100.20 → caps aggressive upside moves
🏦 Fed officials remain split → December rate-cut expectations soften
🌍 Geopolitical risks remain elevated → Middle East & Ukraine tensions
🏛 Central banks continue buying → strong long-term support
📊 ETF inflows slow → partial profit-taking into month-end
The tug-of-war between a cautious Fed and strong global risk demand keeps gold in a premium–discount rotation cycle.
*📆 What’s Ahead Key Events to Watch*
🔸 Flash PMIs — This Week
Manufacturing expected ~49
Services expected ~51
Weak PMI → boosts rate-cut probability → gold bullish
Strong PMI → DXY bounce → gold dips toward demand zones
🔸 US Q3 GDP & Jobless Claims
First major release following the data delays.
Strong GDP = postpones rate cuts → gold bearish
Weak data = safe-haven rotation → gold bullish
🔸 FOMC Meeting — December 16
Markets lean toward a pause, but soft labor data could increase odds of a 25bps cut.
Hawkish tone → tests 4109 → 4088
Dovish tone → pushes gold toward 4184 → 4219 → 4244
🔸 Geopolitical Premium
Any escalation = instant safe-haven spike
Calm + strong USD = controlled pullbacks
*🟩 GOLD TECHNICAL LEVELS*
Gold continues respecting the rising channel, tapping premium zones for sells and discount zones for fresh accumulation.
The recent impulsive move from 4088–4109 has driven price into the next liquidity pocket around 4165+, aligning with your chart’s breakout structure.
*🎯 EQUILIBRIUM (EQ): 4135 – 4140*
This is today’s intraday pivot.
✔️ Hold Above EQ
Momentum strengthens toward:
➡️ 4165 → 4184 → 4196
✔️ Stay Below EQ
Price weakens toward:
➡️ 4109 → 4088
Potential deeper sweep if macro data disappoints.
*🟩 📌 SCALP BUY AREA: 4088 – 4109*
Your primary smart-money demand zone.
Ideal for:
✔️ Intraday dip buys
✔️ First-reaction entries
✔️ Premium → discount rebalance setups
Break below this zone = fast drop toward 4040–4020 liquidity.
*🟥 📌 SCALP SELL AREA: 4184 – 4196*
Clean intraday rejection zone.
Sellers consistently defend this level.
✔️ Best for low-risk scalping shorts
✔️ High-probability liquidity grab
✔️ Wick-heavy reactions expected
A clean close above 4196 opens the door to bigger institutional zones.
*🔺 📌 SMART MONEY SELL AREA: 4219 – 4244*
This is your primary large-volume distribution zone.
Expect:
✔️ Manipulation wicks
✔️ Strong algo-driven sells
✔️ Swing-level reversal setups
Break and hold above 4244 = continuation into 4280+.
*🚨 📌 EXTREME POI (Institutional Orders): 4184 – 4200*
Your mid-range liquidity pocket.
If tapped:
Expect reaction → pullback → re-test unless news breaks strongly in favor of risk-off flows.
*🔻 📌* DEEP SMART MONEY BUY ORDERS (Macro Flush): 3965 – 3985
High liquidity pool—activated only during major macro-driven corrections.
Expect:
✔️ Long wicks
✔️ Violent V-shaped reactions
✔️ High-RR swing long setups
Reclaiming 4,000 from this zone confirms strong bullish intention.
*🕑 ASTROLOGY BUY-THE-DIP TIME: 10:50 – 13:50*
Your key energy window based on astro-timing.
Dips during this window especially near 4109–4088 often align with algorithmic reversal periods.
*📌 Conclusion*
Gold continues to trade level-to-level, with 4135–4140 acting as the key intraday pivot for direction. Holding above this area keeps momentum pointed toward 4184–4196 and potentially 4219, while a break below exposes 4109–4088 for fresh accumulation. With delayed macro data and a divided Fed shaping sentiment, expect controlled swings between premium and discount zones. Stay patient and execute only where smart money is active.
Stay disciplined.
Let the levels do the work.
*🙌 Support the Analysis*
If you find this helpful, please support with your likes & comments it motivates deeper daily analysis.
Share your charts, thoughts & predictions. Let’s grow together.
*Best Regards,*
*M. MOIZ KHATTAK | Founder — TRADE WITH DECRYPTERS*

Gold Pending Buy -4154 -4145 range target 4209expecting buy gold from 4154 to 4145 range,
Goldbach number
Goodluck

Very useful techniques to learnI have recently posted several posts around mechanical and simple charts. This is another insight into some professional techniques that are not often shown.
Gann talked about High and low candles and opposing ticks.
Lowest Tick of the Highest Bar: This refers to the lowest price point (or low tick) of the highest price bar (or highest price period) on the chart. It indicates a crucial support level. If the price falls below this point, it may signal a downward trend or a breakdown.
Highest Tick of the Lowest Bar: Conversely, this refers to the highest price point (or high tick) of the lowest price bar (or lowest price period). This represents a key resistance level. If the price rises above this level, it may indicate an upward trend or a breakout.
Here's an image showing this in an uptrend.
And another for a downtrend.
Then what you would expect from this, would be a move similar to this and of course you can't expect it every time. But to appreciate it, you need to understand the logic as to why this is important in the first instance.
The simple explanation of that is in an uptrend that lowest tick of the highest bar was in fact the exact area buyers failed and sellers took control. Obviously, the inverse is true of a downtrend. The highest point of the lowest candle, means buyers are back pushing prices higher.
Into the future you MIGHT but not always see these levels as support or resistance.
When you overlap this with the mechanical techniques, you can use this for range entries. Here's a post on mechanical techniques.
==========================================
Second tip is to do with volume.
Many people seem to have volume on their chart, but don't really know how to utilise it.
Now, imagine the areas I mentioned in the first tip. As price nears these zones (other other zones) order blocks, supply or demand, fib levels.
If you could quickly identify what story volume is trying to tell you. Then there is a huge benefit to know how you need to react to the price action.
In this image; Look at the spikes in volume until the orange arrow point.
What you can see from this next image, is the orange arrow is the turning point.
For it's next stop after breaking through the PoC of the range from the prior low to its high. You can draw a line, extended from the highest tick of the lowest candle.
Price comes back, and as explained in the example above. Buyers step back in and drive the price directly away from this level.
Now; let's go one step further.
In this image I have the volume profile on the left representing the swing low to high and then the profile on the right from that high to the fresh swing low.
You can see from the sell side pressure where price has interest to both parties.
Next you have both lines drawn on the chart of the opposing candles, like this.
Here. we can look at if the market is seeking outside or inside liquidity.
However, if you look back at the volume on the bottom of the chart. Are we seeing green candles and volume increasing? or red candles with volume increasing? This is where the second tip becomes very, very useful.
If you can identify the phase of internal or external, areas of interest. You can confirm this with volume clues on the chart and you will find yourself on the right side of the trade more often than not.
Have a great week all!
Disclaimer
This idea does not constitute as financial advice. It is for educational purposes only, our principal trader has over 25 years' experience in stocks, ETF's, and Forex. Hence each trade setup might have different hold times, entry or exit conditions, and will vary from the post/idea shared here. You can use the information from this post to make your own trading plan for the instrument discussed. Trading carries a risk; a high percentage of retail traders lose money. Please keep this in mind when entering any trade. Stay safe.
XAUUSD PredictDisclaimer: Not Financial Advice
The information provided is for general informational and educational purposes only and is not intended to provide specific financial or investment advice. The content presented does not take into account your personal investment objectives, specific goals, or financial situation and needs.
Accordingly, before taking any actions based upon such information, we strongly encourage you to consult with a qualified, licensed financial advisor or other appropriate professional. All investments are subject to risk, and you assume full responsibility for any loss or damage resulting from your use of or reliance on the information provided.
We are not liable for any errors or omissions in this information or for any losses, injuries, or damages from the display or use of this information.

GOLD: Improved Volume Signals Potential Upside for GoldGOLD: Improved Volume Signals Potential Upside for Gold
Yesterday the volume was very low and failed to start the uptrend. Perhaps it was also in this situation because of the NFP data that came out better than expected and the US dollar showed strength again.
Gold found strong support in our old area near 4030 from where it recovered again. Currently gold reached 4078 and chances are it will rise further.
Today's volume seems to be better compared to all other days combined. The fundamental analysis did not change during all these days.
Targets remain the same:
4150
4230
With extension levels at 4290 and 4360 if momentum accelerates
You may find more details in the chart!
Thank you and Good Luck!
❤️PS: Please support with a like or comment if you find this analysis useful for your trading day❤️
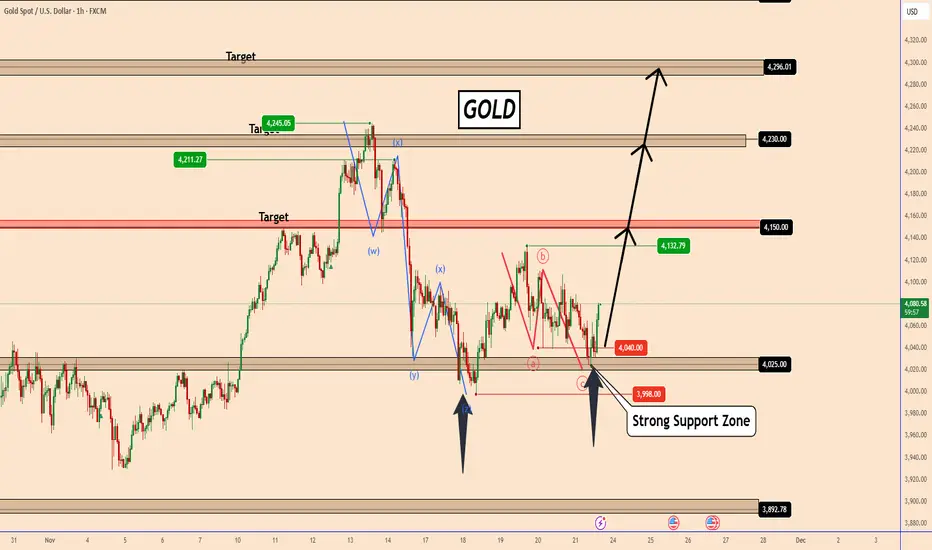
XAU/USD: Strong Uptrend, Ready to Break to New HighsHello traders! Today, we’ll analyze gold (XAU/USD), which is currently in a strong uptrend, and explore opportunities to capitalize on this momentum.
The latest news shows that gold has surged on November 26th, with the market anticipating that the Federal Reserve (Fed) might cut interest rates in December. Spot gold reached its highest level since mid-November, touching 4,170 USD/ounce. Factors such as mixed economic data from the U.S ., concerns about the labor market , and weakening consumer confidence have created a positive sentiment for gold.
From a technical analysis standpoint, the chart shows that XAU/USD is moving in a clear ascending wedge . The current price is near the support zone at 4,130 USD, with the potential for the uptrend to continue towards 4,240 USD if the price maintains its bullish momentum. Indicators like EMA 34 and EMA 89 both support the upward trend, reinforcing the potential for new highs.
Trading Strategy: Buy when the price adjusts to 4,130 USD and shows signs of reversal. The target for the uptrend could be 4,240 USD, and if the price breaks this level, we can expect gold to move towards 4,300 USD. A stop-loss can be placed around 4,120 USD to protect the account.
With positive market trends and technical support, gold is likely to continue its upward momentum in the near future. Stay updated and take advantage of this opportunity!

possible buy on goldprice has been consolidating around 4160 area,, so i am expecting more push to the higher price previously..

GOLD XAUUSD 60mins BUY Trade ForecastStalking Xau for a potential bullish movement.
All we need now as confirmation to proceed Long with gold on 15/60mins TF is t he inability of price to continue short beyond the drawn line as depicted on the chart.
Will update you once the ticks are green and ready for the launch.
:)

XAUUSD: Will It Continue to Decline?Last week, I had been continuously suggesting going long on gold, and the market aligned with my analysis by breaking through the $4,200 level rapidly. However, not every trader followed my strategy to go long.
There are likely still many traders who chose to go short and thus incurred losses. A downward correction is expected next week, which may be your last chance to exit .
I send out accurate signals every day after the market opens, so don’t miss out.

XAUUSD BULLISHGold rally towards the Fair value gap, could determine how december rolls, sentimental support around $4000, providing a boost.
If the price rejects at the FVG price could turn bearish to end the year.
However, if there is a break out, we could see gold being bullish to open 2026.

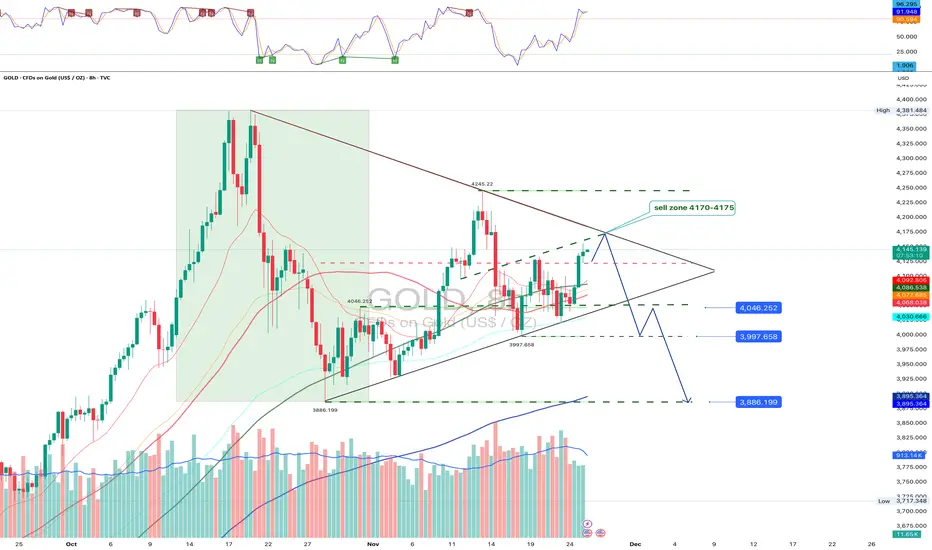
GOLD approaches a critical inflection inside the triangleGold is compressing inside a large triangle on the four hour chart and has returned to the twenty four hundred seventy area which acts as the main sell zone at four thousand one hundred seventy to four thousand one hundred seventy five. The market still fails to break above this region and preserves a sequence of lower highs. A breakdown through the triangle support may open the path toward four thousand forty six three thousand nine hundred ninety seven and three thousand eight hundred eighty six where strong liquidity and the two hundred period moving average converge.
The fundamental picture as of November twenty fifth remains mixed. United States inflation is cooling more slowly than expected which keeps treasury yields elevated and limits the attractiveness of gold as a defensive asset. Market expectations for a Federal Reserve rate cut in the first half of next year persist which supports the metal during pullbacks. Demand from Asian jewelry markets stays muted which adds pressure when yields rise.
Price is approaching a decision point. A rejection from the sell zone may send the market toward four thousand forty six three thousand nine hundred ninety seven and three thousand eight hundred eighty six. A confirmed move above four thousand one hundred seventy five will invalidate the bearish scenario and allow a possible breakout to the upside although the market still looks weaker than the seller for now.
Gold is precious without doubt but inside a triangle nothing shines too confidently until the market shows its choice.