XAUUSD Bearish OutlookGold has faced strong selling pressure near the all-time high just below the $4,400 psychological level. Key support sits around $4,050–$4,000, and a break below could trigger a sharper correction toward $3,500.
On the macro side, potential progress in U.S.–China trade talks and resolution of the U.S. government shutdown could boost market optimism and reduce safe-haven demand for gold. Meanwhile, markets remain heavily positioned for FOMC rate cuts — any disappointment or less-dovish tone from the Fed could unwind those bets, adding further downside pressure.
Trade ideas

GOLD recovers ahead of US CPI data, key data dayArticle summary:
“Gold rebounded in the Asian session on October 24, trading around $4,139/ounce, as safe-haven flows surged amid renewed geopolitical tensions and investors awaited September US CPI data, which could determine the Federal Reserve’s monetary policy moves in the short term.
The recovery momentum was reinforced by expectations of an early Fed rate cut, along with the impact of Washington’s new oil sanctions on Russia and escalating US-China trade tensions. Meanwhile, technically, gold held support around $4,100, suggesting the medium-term uptrend remains intact.”
OANDA:XAUUSD maintained its recovery momentum in the Asian session on October 24, trading around $4,139/ounce, after rising sharply in the Thursday session thanks to the return of safe-haven flows amid fresh geopolitical developments. The move came as global markets await key US inflation data (September CPI), which is seen as key to shaping the direction of the Federal Reserve's monetary policy in the short term.
Economic data
The US Bureau of Labor Statistics (BLS) will release its September Consumer Price Index (CPI) tonight.
Forecasts show the US core CPI rising 0.3% month-on-month and remaining at 3.1% year-on-year, suggesting persistent inflationary pressures despite signs of cooling energy prices.
The market has all but priced in a 25 basis point rate cut by the Fed at its policy meeting next week. In a low-interest-rate environment, gold, a non-yielding asset, tends to benefit from lower opportunity costs.
“Gold’s goal is to continue its rally ahead of the CPI data,” says Valeria Bednarik of FXStreet.
Political and Geopolitical Events
Gold prices rebounded after the US imposed new sanctions on two major Russian energy companies, Lukoil and Rosneft. This is the first sanctions of President Donald Trump's second term and is seen as a significant escalation in the pressure campaign against Moscow.
According to Jorge Leon, Director of Geopolitical Analysis at Rystad Energy, "This move marks a major and unprecedented escalation in Washington's campaign against Russia."
The sanctions could impact global oil supplies, indirectly increasing the appeal of gold as a hedge against risks in an uncertain environment.
In addition, US-China tensions have also resurfaced as the White House considers restricting China’s use of US software, retaliating against Beijing’s rare earth export controls and raising port fees for US-flagged ships. These signals reinforce the “selective risk-off” sentiment in global markets.
In short, the current developments suggest that gold is repositioning itself in a medium-term bull cycle, as the market simultaneously assesses geopolitical risks and the prospect of Fed easing.
If CPI data reinforces the case for a Fed rate cut at the upcoming meeting, gold could retain its appeal as a key safe-haven asset in the fourth quarter.
Technical Outlook Analysis OANDA:XAUUSD
Technical analysis:
Gold prices are maintaining a technical recovery after a strong correction from the peak of 4,379 USD/ounce. Currently, the price is trading around 4,118 USD, approaching the Fibonacci support zone of 0.618 (4,110 USD), an important milestone to determine the short-term supply-demand balance.
On the daily chart, gold is still in the medium-term uptrend channel formed since mid-August, with the MA21 average line (4,000 USD area) continuing to act as a dynamic support base. RSI has reached the 50 area and is showing signs of forming a slight bottom, reflecting the weakening selling momentum.
In terms of patterns, the candlestick cluster of the last 2 days shows a "hammer - recovery confirmation" pattern, suggesting that demand is reappearing at the technical bottom.
Trend Assessment:
If the $4,100 zone holds, there is a high probability that gold will enter a bullish consolidation phase towards the $4,200 mark. However, a break of the $4,000 zone would open up a deeper correction towards the $3,950 area.
In the context of lower interest rate expectations and geopolitical tensions that have not yet subsided, the medium-term trend of gold remains bullish, although the current recovery is more technical than a fundamental breakout.
SELL XAUUSD PRICE 4221 - 4219⚡️
↠↠ Stop Loss 4225
→Take Profit 1 4213
↨
→Take Profit 2 4207
BUY XAUUSD PRICE 4057 - 4059⚡️
↠↠ Stop Loss 4053
→Take Profit 1 4065
↨
→Take Profit 2 4071

The gold-driven logic behind the US attack on VenezuelaThe "black swan" shock in the global crude oil market: Venezuela, as an important member of OPEC, produces 1.2 million barrels of oil per day (accounting for 1.3% of global crude oil supply), and controls 18% of the world's proven oil reserves. If the US military strike causes the paralysis of its oil facilities (such as the Maracaibo Lake oil field and the Caribbean Sea ports being bombed), global crude oil supply will instantly decrease by 1.2 million barrels per day. Coupled with the fact that the situation in the Middle East has not yet eased, the Brent crude oil price may soar from the current $85 per barrel to $120-130 per barrel, reaching a new high since 2022.
The signal of restarting the inflation spiral: For every $10 increase in crude oil price per barrel, it will push up the US core CPI by 0.3-0.4 percentage points. If the oil price exceeds $120, the US CPI may return to above 4% in December 2025. This will completely reverse the market's expectation of "inflation moderation", and the demand for gold as an "inflation-resistant hard asset" will experience an explosive growth - during the 2022 Russia-Ukraine conflict, the inflation concerns triggered by the oil price increase led to a 5.8% weekly increase in gold prices. This scenario shock is even stronger, with a weekly increase of over 7%.
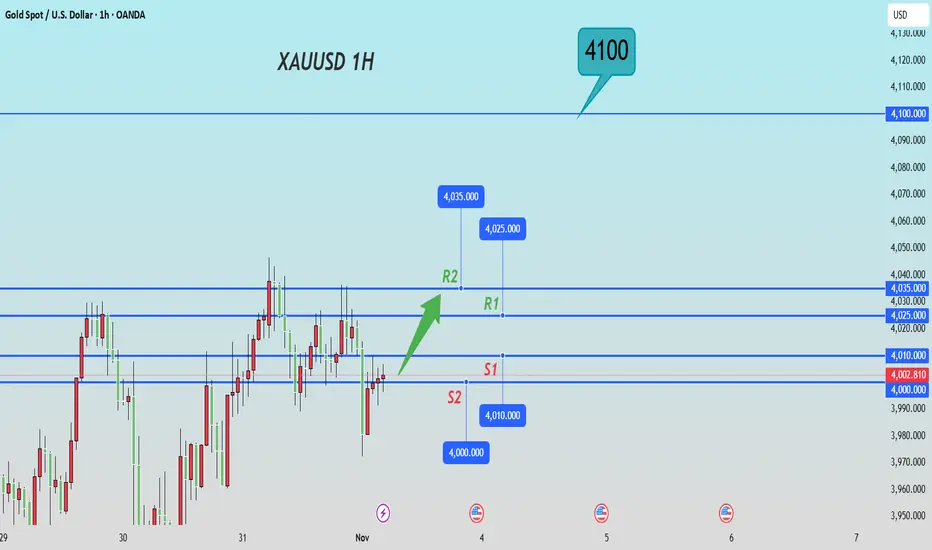
Next week's trading strategy and analysis
buy:4000-4010
tp:4025-4035-4100
sl:3995
Gold Trade IdeaGold is testing back 4000. 2 additional resistances also share the 4000 so it will be a strong intraday resistance. The idea came with 3.14 RR.

Gold Intraday Trading Plan 10/31/2025Gold has found support at 3920 yesterday and quickly went up. Currently it is at 4030 resistance. I will look to buy from 4000 and if 4030 is broken, it should test 4095. However, if 4000 is broken, gold may resume downward momentum.

XAUUSD Buy Setup - Bullish Continuation From 39661H chart shows strong bullish impulse followed by consolidation.
Price holding above structure — continuation likely if support holds.
Setup: Buy on pullback near 3980 with targets up to 4100.
Stop below 3865 to protect from invalidation.
‹ Educational analysis only. Not financial advice

Will gold fall below 3900 again on October 29?
Current Market Characterization: Volatile with a bearish bias. Gold prices have broken below the key psychological level of $4,000, indicating short-term technical weakness. The market is currently caught between long-term bullish fundamentals and short-term factors such as easing geopolitical risks and improved risk appetite. Ahead of the Federal Reserve's interest rate meeting, volatile and range-bound trading is likely to persist.
I. Core Market Logic
Short-Term Bearish Factors:
Technical Selling Pressure: Last week’s significant sell-off has led to further weakness in technical indicators.
Improved Risk Appetite: Signs of easing geopolitical tensions (e.g., trade negotiations) have reduced gold’s appeal as a safe-haven asset.
Break of Key Support: The loss of the $4,000 level (coinciding with the long-term uptrend line) has intensified bearish sentiment.
Medium- to Long-Term Supporting Factors:
Fed Rate Cut Expectations: The market has almost fully priced in a 25-basis-point rate cut in October, with another cut expected in December. This limits the downside for gold prices in the long run.
II. Key Price Levels
Bullish Defense Line: $4,020
If gold fails to reclaim and stabilize above this level, the short-term bearish trend is likely to continue.
Core Resistance Zone: $3,970 - $3,990
This area, formed by the 5-day and 10-day moving averages, serves as a strong short-term resistance zone and an ideal entry point for short positions.
Support Zone: $3,880 - $3,890
This is the current near-term key support band. If gold stabilizes here, a technical rebound may occur.
Breakdown Target:
If the $3,880 - $3,890 support band is decisively broken, bears will likely test lower support levels.
III. Intraday Trading Strategy
Primary Approach: Prefer selling on rallies, with light long positions at key support levels as a secondary strategy.
Short Strategy (Primary):
Entry Timing: Wait for gold to rebound to the $3,970 - $3,990 resistance zone and show signs of rejection before entering short positions.
Profit Target: Initial target at the $3,900 - $3,910 support band. Secondary target at $3,870 - $3,880.
Stop Loss: Place above $4,000.
Long Strategy (Secondary):
Entry Timing: If gold retraces to the $3,880 - $3,890 support band and shows signs of stabilization or reversal on shorter timeframes (e.g., 1-hour/4-hour charts), consider entering light long positions.
Profit Target: Aim for $3,950 - $3,970.
Stop Loss: Place below $3,870.
IV. Trading Discipline and Risk Warnings
Follow the Trend: As long as the price remains below $4,020, the overall strategy should favor selling on rallies rather than attempting to buy the dip against the trend.
Exercise Patience: Only execute trades when prices approach key resistance or support levels. Avoid impulsive trading in intermediate ranges and refrain from chasing the market.
Strict Risk Management: Market sensitivity is heightened ahead of the Fed meeting. Always adhere to stop-loss orders to mitigate risks from unexpected fluctuations.

XAUUSD: Market Analysis and Strategy for October 30Gold Technical Analysis:
Daily chart resistance: 4090, support: 3840.
4-hour chart resistance: 4050, support: 3890.
1-hour chart resistance: 4030, support: 3916.
Technical Analysis: Gold prices rebounded technically after falling nearly 5% over four consecutive trading days. The market faced short-term headwinds due to Powell downplaying the possibility of a December rate cut; however, widening divisions within the Federal Reserve regarding interest rate decisions have introduced new uncertainty to the market. Meanwhile, the trade easing agreement reached between the US and China has weakened safe-haven demand.
The daily chart shows a stepped decline, with four consecutive days of losses up to the previous trading day, and the moving average system has formed a death cross. After the European market opened today, prices rebounded rapidly. Short-term resistance levels to watch are 4010 and 4030. If gold can hold above 4010 and remain firmly above 4000, it will likely attract previous buying interest and resume its long-term upward trend. Conversely, if gold fails to recover and hold above 4000, selling on rallies is advisable.
Looking at the 1-hour chart, the moving averages have formed a golden cross, and the MACD/KDJ indicators are providing upward momentum. In the short term, focus on the continuation of the upward trend, paying particular attention to yesterday's rebound high of 4006 and the previous trading day's rebound high around 4030.
Trading Strategy:
SELL: 4050~4056 near
BUY: 3966~3960 near
More Analysis →

Gold surges strongly after Fed decision – eyes on 4000+ breakout1. Market Movements
After the Federal Reserve cut interest rates by 0.25% and signaled a potential end to quantitative tightening (QT), gold extended its strong upward momentum.
Institutional and ETF buying continues to drive prices higher, with gold now testing the key psychological level at $4000/oz.
2. Technical Analysis
• Near-term Support: $3960 – $3970
• Deeper Support: $3935 – $3940 (pre-Fed accumulation zone & H4 EMA50)
• Immediate Resistance: $3988 – $4000
• Extended Resistance: $4025 – $4040 (mid-October technical high)
• Momentum: Both EMA20 and EMA50 on H1 and H4 are sloping upward, confirming strong bullish momentum. RSI remains elevated (70–75), signaling overbought but still strong trend conditions.
• Volume: Continues to rise steadily, showing sustained institutional inflows. However, short-term correction risks remain near $4000 due to overextension.
3. Outlook
The overall trend remains bullish, but caution is advised as gold approaches the $4000–$4040 resistance zone — a potential area of strong profit-taking.
If gold fails to break above $4040 decisively, a short-term pullback toward $3970 or $3940 is likely.
4. Suggested Trading Plan
🔺 BUY XAU/USD
Entry: $3925 – $3928
🎯 TP: 40 / 80 / 200 pips
🛑 SL: $3922
🔻 SELL XAU/USD
Entry: $4037 – $4040
🎯 TP: 40 / 80 / 200 pips
🛑 SL: $4043

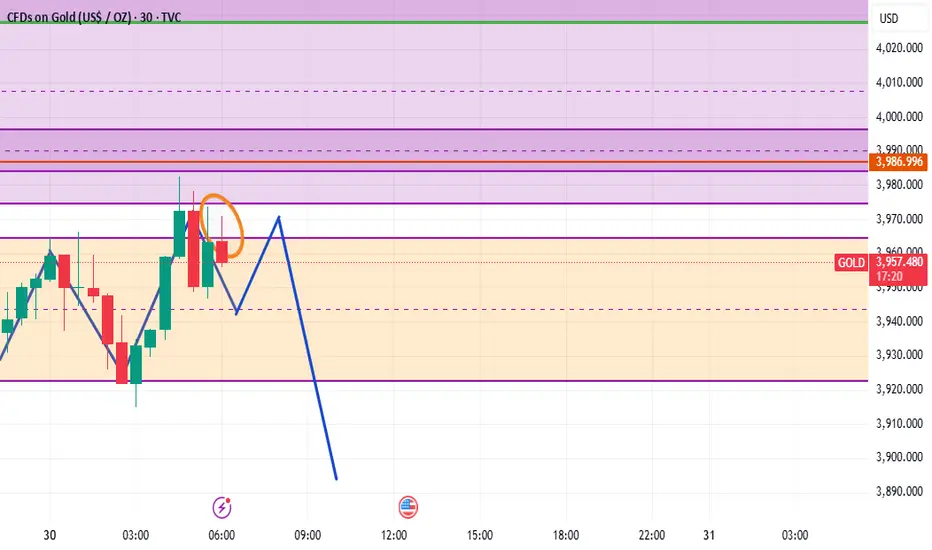
CONFIRMATION If this candle in the sphere/circle closes bearish then it will be a good sign of sells but if it closes bullish then selling probability will be very low

XAUUSD ForecastGold has broken out of the descending wedge pattern, signalling a potential bullish reversal. Price is currently retesting the breakout zone near the 3,980–4,000 support area. A successful bounce from this level could trigger an upward move toward the first target at 4,045 and the second target around 4,100. Holding above the retest zone will confirm bullish momentum continuation.
"Thank you for your support! If you found this idea valuable or learned something new, please consider liking and leaving a comment. I’d really appreciate hearing your feedback and thoughts

XAUUSD: Gold Battles the Key 4000 ZoneXAUUSD: Gold Battles the Key 4000 Zone
Hey everyone! Let's dive into Gold (XAUUSD) on the 4-hour chart, where we've seen some dramatic moves recently.
What We've Seen:
Gold made a strong run earlier in the month, but was firmly rejected twice at the 4400 mark, forming a clear "Double Top" pattern (marked with red circles). This led to a significant pullback, pushing price down through several support levels.
Currently, Gold has found some footing after hitting a low and is now attempting to recover.
The Current Battleground: 4000 Key Zone
Price is currently retesting the crucial 4000 Key Zone (highlighted in blue). This level acted as support previously, was broken, and is now being challenged again. The immediate task for buyers is to "Observe the price action if it can break the recent swing high" (marked with the purple circle) just below 4000, which has been acting as immediate resistance.
Scenario 1: Bullish Reclaim & Push Higher (If 4000 Holds Strong)
If Gold can successfully reclaim and hold above this 4000 Key Zone, it would be a strong bullish signal. This could open the door for:
A push towards the 4150 to 4250 1st Resistance zone, where sellers might step in again.
A more sustained recovery attempt, potentially aiming higher if that resistance is overcome.
Scenario 2: Rejection & Further Downside (If 4000 Proves Too Strong)
However, if the 4000 Key Zone acts as strong resistance and Gold fails to break above that recent swing high, we could see:
A reversal back towards the 3900 Immediate Support level.
Should 3900 fail to hold, the next significant support would be the 3800 to 3850 Next Support area.
In Summary:
The 4000 Key Zone is the pivotal point right now. Watch how price reacts here and whether it can overcome that immediate swing high resistance. This will largely dictate Gold's direction in the short term.
Disclaimer:
The information provided in this chart is for educational and informational purposes only and should not be considered as investment advice. Trading and investing involve substantial risk and are not suitable for every investor. You should carefully consider your financial situation and consult with a financial advisor before making any investment decisions. The creator of this chart does not guarantee any specific outcome or profit and is not responsible for any losses incurred as a result of using this information. Past performance is not indicative of future results. Use this information at your own risk. This chart has been created for my own improvement in Trading and Investment Analysis. Please do your own analysis before any investments.

Gold Rebounds Strong – Next Stop 4230!Gold (XAUUSD) showed a sharp decline in last two days, marking a strong correction phase after making new highs. However, today’s price action indicates that buyers are stepping back in around the 4000 psychological Major support Area.
Currently, gold is trading near 4113, and now there are high possibilities that gold will go for long till the Target level 4160 and Target level 4230..
KEY POINTS
Current price 4113
Target level 4160
Target level 4230
Major support 4130/4100

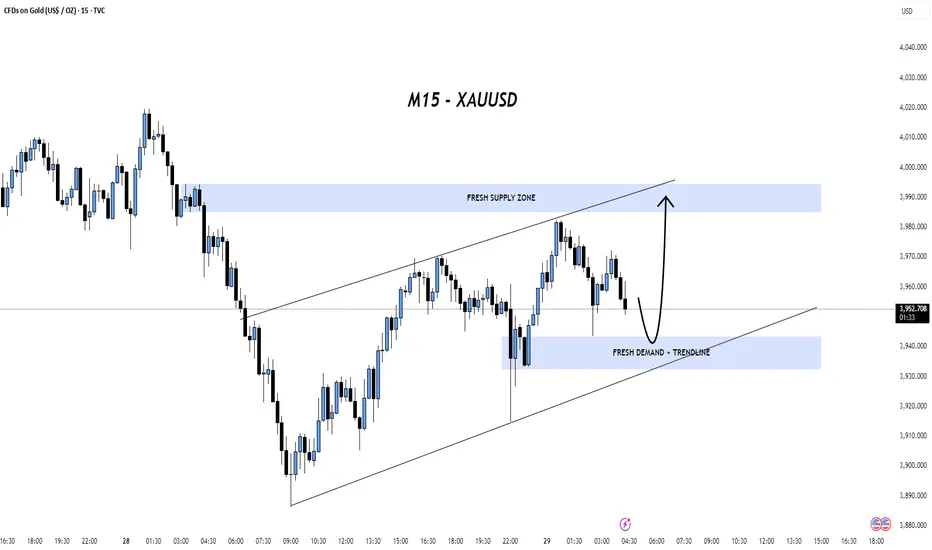
GOLD TimeFrame - M15Reason i choose focus : BUY/SELL
🟢FRESH DEMAND + TL ZONE 🟢
🟢WAITING REJECTION = BUY 🟢
🟢NEXT PRICE MAKE HH M15 🟢
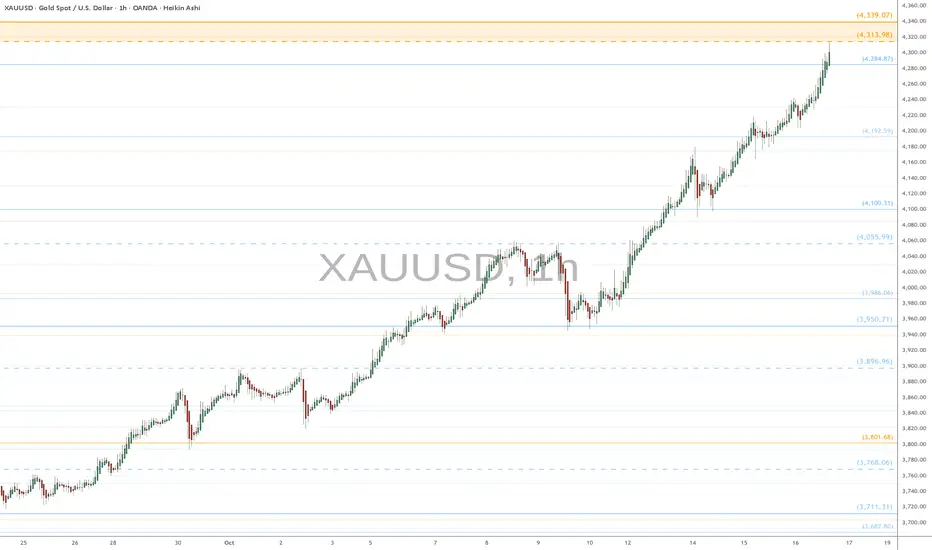
XAU.usd watch $4313-39: Gold about to hit Double Golden fibsGold continues its relentless climb into new highs.
Nearing Double Golden fibs at $4313.98 - 4339.07
Looking for a Dip-to-Fib or Break-n-Retest entries.
IF there is a top anywhere near here,
then THIS will be the ideal spot for it.
.
See "Related Pubications" for previous plots such as this PERFECT DIP:
Hit BOOST and FOLLOW for more such PRECISE and TIMELY charts.
=========================================================
.
XAUUSD 4D Market OutlookReversal Top Signals Correction Ahead as Fed Cut Nears
Gold surged to an all-time high early last week but reversed sharply, forming a weekly closing price reversal top, a potential warning of a near-term pullback. The rally had been fuelled by expectations of Fed rate cuts and robust central bank demand, but with sentiment stretched and no fresh catalyst, traders took profits.
Despite softer inflation data that reinforced expectations of a 25-basis-point Fed cut at the October 28–29 meeting, gold failed to recover lost ground. Strength in equities and a modest rebound in the dollar weighed on the metal, suggesting buyers may wait for **lower entry levels.
The Fed’s easing stance is now driven by a weakening labour market rather than inflation. Slower job growth and large downward revisions to payrolls have prompted Powell to act pre-emptively. While this longer-term dovish outlook supports gold, the short-term technical picture favours consolidation.
Technical Outlook
The reversal top pattern isn’t confirmed yet, but continued selling would likely target $3846.50, then the 61.8% retracement near $3720.25. Unless the Fed signals a more aggressive easing path, gold may remain under **short-term corrective pressure** before resuming its broader uptrend.

XAUUSD📊 GOLD (XAUUSD) – Multi-Timeframe Technical Outlook
Monthly:
Gold closed the last monthly candle bullish, even with a long upper wick.
✅ Buyers are still in control
⚠️ But the wick shows loss of momentum at the top
✅ Weekly Timeframe
Price broke out of a symmetric triangle, and for 9 consecutive weeks, gold pushed aggressively to the upside.
However, the last two weekly candles show:
smaller bodies
longer wicks
loss of momentum
📉 If this correction continues, price may come back down to retest the broken triangle around the 3,500 zone.
This retest would collect liquidity and give the market structure needed to build a new leg toward the 5,000 long-term target.
✅ Daily Timeframe
Recent high near 4,400
Price dropped to 4,000 → new low
Pullback to 4,150 → Lower High
Deeper drop to 3,886 → new lower low
Bounce up to 4,046 → another Lower High
🔻 Conclusion on D1:
The daily structure is bearish with a clear sequence of Lower Highs, showing loss of bullish strength.
✅ H4 Timeframe
On H4, price is currently forming a bearish flag pattern — slow, corrective movement after the drop.
If price breaks below the flag, that would open the door for another leg down, targeting:
3,900
3,750
and possibly the 3,500 weekly retest zone
📌 Summary
Monthly → bullish but losing steam
Weekly → breakout confirmed, but correction likely before continuation
Daily → bearish market structure
H4 → bearish flag building momentum for another drop
If the flag breaks down, the next major liquidity zone sits around 3,500 — the same zone as the symmetric triangle retest.
🔥 Bias: Bearish short-term
🚀 Long-term: Bullish continuation toward 5,000 after deeper correction


Gold still sitting in the roller coaster!In our previous analysis of WXY pattern, it would make wave-Y so much bigger than wave-W that it went against the guideline of the Right-Look. So here we have a better labelling. Note that Wave-Equality among W and Y stands at $3761.

CONFIRMATION CANDLE Bullish confirmation candle , more buys expected, and it will definitely buy more especially if h1 also closes bullish by 5am

Oct 31, 2025 - XAUUSD GOLD Analysis and Potential Opportunity📊 Analysis:
On the higher timeframes, bearish momentum is weakening while bullish strength is starting to emerge.
If price breaks above 4047, watch the 4050 resistance closely — once price holds above 4050, bullish momentum should become clear, and the plan shifts to buying pullbacks into support.
If price falls below 4016, bullish strength weakens, and the strategy turns to selling rallies into resistance.
Also, keep an eye on 3960 — a break below this level would signal renewed bearish pressure.
🔍 Key Levels to Watch:
• 4085 – Resistance
• 4073 – Resistance
• 4065 – Resistance
• 4043–4050 – Resistance zone
• 4024 – Support
• 4000 – Psychological level
• 3987 – Support
• 3978 – Support
• 3960 – Key intraday support
📈 Intraday Strategy:
SELL: If price breaks below 4016 → target 4011, with further downside toward 4008, 4001, 3995
BUY: If price holds above 4040 → target 4043, with further upside toward 4046, 4050, 4055

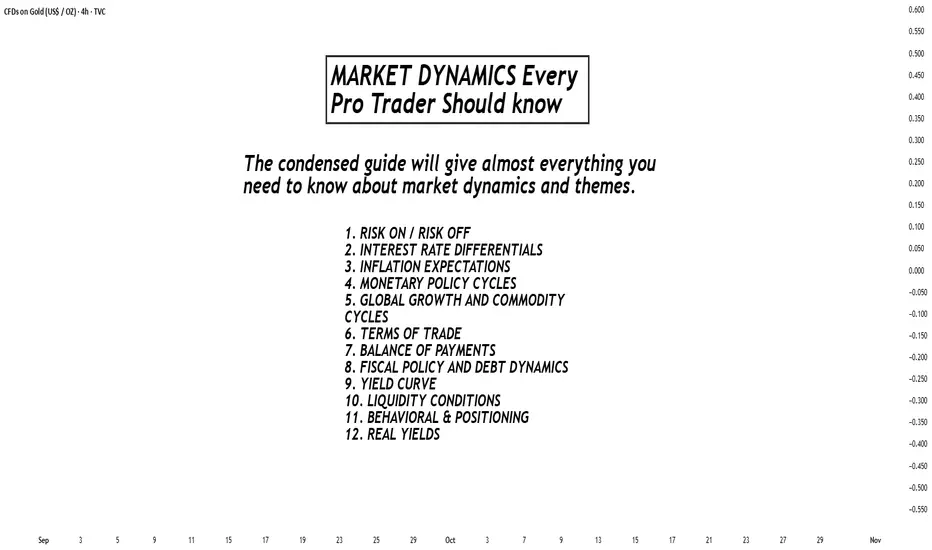
Markets Dynamics Every Pro Trader Should KnowMarkets move based on fundamental forces that shape pro traders behavior, capital flows, and asset valuations. I will cover the most important concepts that drive market behavior across all asset classes and are fundamental to professional traders.
RISK-ON / RISK-OFF DYNAMICS
The most important concept is the oscillation between risk-on and risk-off sentiment—investor willingness to take on risk in pursuit of returns.
Risk-On: Equities, commodities, high-yield bonds, and risk-sensitive currencies like AUD, NZD rise.
Typical triggers are: positive economic data, easy central bank policies, geopolitical stability.
Risk-Off: Safe-haven assets : USD, JPY, CHF, U.S. Treasuries, gold strengthen. This happens as money managers and investors prioritize capital preservation.
Typical triggers: negative economic data, geopolitical tensions, financial crises.
Why USD strengthens during risk-off:
USD has a global reserve currency status, and that structurally creates demand; deepest treasury market for holding capital; trillions in global debt denominated in USD.
Why JPY strengthens during risk-off:
Carry trade unwinding (investors close positions by buying back yen); Japanese institutions bring back home trillions in foreign assets during crises.
INTEREST RATE DIFFERENTIALS
Capital moves toward countries offering higher real interest rates (real rates = nominal rates minus inflation). This creates currency trends over weeks, months, and years.
Higher interest rates leads to higher bond yields, increasing capital inflows, resulting in currency appreciates
The Carry Trade: Borrow in low-yield currencies (JPY, CHF), invest in high-yield currencies (AUD, NZD), profit from interest rate differential. Carry trades unwind strongly during risk-off times due to leverage and crowded positioning.
INFLATION EXPECTATIONS
Markets trade based on where they expect inflation to be in the future, not current readings. Rising inflation expectations means central banks are likely to tighten policy, hence Bond yields rise and that may lead to currency strengthening initially.
Key metrics: CPI (Consumer Price Index), PCE, core vs. headline inflation, break-even inflation from TIPS spreads.
MONETARY POLICY CYCLES
Central banks are the most powerful players in financial markets. They control interest rates and balance sheet operations.
Tightening Cycle (hiking rates, quantitative tightening): Strengthens currency, negative for equities, bond prices fall, slows economic activity.
Easing Cycle (cutting rates, QE): Weakens currency, positive for equities, bond prices rise, stimulates economic activity.
GLOBAL GROWTH AND COMMODITY CYCLES
Strong global growth means higher demand for energy/metals = Commodity prices rise = Strengthens commodity currencies (AUD, CAD, NOK, BRL).
Key indicators to watch: Global PMIs, global trade data, commodity indices, China growth indicators.
TERMS OF TRADE
When a country's export prices rise more than its import prices, local income increases and currency typically strengthens. Example: Australia's AUD strengthens when iron ore and coal prices rise.
BALANCE OF PAYMENTS
Current account measures trade balance, income flows, and transfers.
Surplus (exports > imports): This accumulates foreign reserves, and generally supports currency.
Deficit (imports > exports): This requires capital inflows to fund deficit, and can pressure currency lower.
FISCAL POLICY AND DEBT DYNAMICS
Government spending and taxation are another dynamic that can influence economic growth and inflation.
Expansionary Policy: Higher spending or lower taxes = short-term growth boost = can increase inflation = increases deficit.
Contractionary Policy: Lower spending or higher taxes (this is know as “austerity”) = slows growth =reduces inflation = improves budget balance.
YIELD CURVE
One of the most important dynamics: it plots interest rates of government bonds across different maturities (2-year, 10-year, 30-year).
Normal/Steep Curve: Growth and inflation optimism, typically supports risk-on sentiment.
Flat Curve: Uncertainty about future growth, usually in late-cycle economies.
Inverted Curve (short rates > long rates): Recession warning. markets expect the central bank to cut rates due to the slowing economy. The inverted curve has preceded almost every U.S. recession in the past half decade.
LIQUIDITY CONDITIONS
Liquidity means availability of credit in the financial system.
High Liquidity: Credit is easy and cheap, supports asset prices, enhances risk appetite. Sources of ample liquidity are central bank QE, low interest rates.
Tight liquidity: Credit becomes scarce and expensive, forces deleveraging, triggers risk-off sentiment. Reasons that can lead to low liquidity are central bank QT, rising rates, banking stress.
BEHAVIORAL & POSITIONING DYNAMICS
When too many investors are positioned the same way (crowded trade), small sentiment changes can trigger strong reversals. Extreme bullishness can signal sell opportunities when everyone is fully invested. Extreme bearishness can signal buy opportunities when selling pressure is exhausted.
Key indicators to measure market positioning are: CFTC positioning data, VIX (volatility index), put/call ratios, fund flow data.
REAL YIELDS
Real Yield = Nominal Yield - Expected Inflation
Rising Real Yields: Stronger currency (attracts foreign capital), weaker gold (higher opportunity cost), pressure on growth stocks.
Falling Real Yields: Weaker currency, stronger gold, support for growth/tech equities.
Real yields drive cross-asset flows through opportunity cost (risk-free alternative return), discount rate changes (affects stock valuations), and dollar funding (global capital flows).
BOTTOM-LINE AND DYNAMICS INTERACTIONS
Markets are driven by multiple forces simultaneously. The strongest moves occur when multiple dynamics align in the same direction. Identify the dominant theme (inflation? growth? central bank policy?), understand asset class implications, look for alignment, and monitor for shifts.
Example Scenario - Fed Aggressive Tightening: Fed raises rates and begins QT → U.S. yields rise → Rising real yields → Tighter liquidity → Risk-off sentiment → USD strengthens, AUD/NZD/EM weaken, gold falls, growth stocks underperform.
Success comes from identifying the dominant market theme, understanding implications across asset classes, looking for alignment when multiple dynamics point in the same direction, and monitoring for theme shifts that can reverse the entire market structure quickly.
If you have questions or need any explanation don't hesitate to drop a comment.