Gold on side Swings on Fed aftermathAs discussed throughout yesterday's session: 'My position: I am Buying Gold aggressively throughout yesterday's session all along especially when #3,952.80 benchmark got invalidated to the upside. Gap to the downside on Asian market opening delivered excellent chances to Buy more as I closed all orders with #4,000.80 Take Profit. Keep in mind that I might Sell #4,024.80 now (aggressive Scalp to the downside) only to Buy more. #4,052.80 benchmark and #4,100.80 extension are my Targets.'
If you followed Trading plan I announced above, you would be in excellent Intra-day Profits. I have Sold Gold from #4,027.80 High's multiple times and re-Bought Gold from #4,004.80 especially delivering excellent results and altered all my Trading activity (no need to gamble on Fed Rate decision aftermath). My Profit is excellent and will sit out today's session as it will be full of side-Swings where I will continue comfortable Trading throughout tomorrow's session.
Trade ideas

This is just a rebound, not a reversal. Continue to short gold.The Fed's interest rate decision is highly anticipated, and the question remains whether gold bulls can stage a comeback. Gold is currently in a rebound and correction phase after an oversold condition. It's premature to declare a complete reversal of the bullish trend. Gold's rebound from its lows suggests a period of consolidation in the short term, awaiting the Fed's decision to determine its direction.
The 1-hour moving averages for gold continue their downward crossover, indicating that the bullish momentum hasn't fully materialized. However, there is gradually building support at lower levels. If a strong upward surge occurs before the Fed's decision, the bullish momentum may wane afterward. A break above 4020 would confirm a true V-shaped reversal for gold. Failure to break through 4020 suggests continued range-bound trading, with support around 3890. A hold above 3890 would likely lead to a rebound.
With the Fed's interest rate decision looming, let's wait patiently. Whether gold has finished its correction and whether the bulls have begun their counterattack remains to be seen. We'll observe the strength of the bulls after the Fed's decision. If gold breaks through and holds above 4020, the short-term upward momentum will increase.
Trading Strategy: Sell gold at 4010-4020, with a target of 3950-3930.

AT ENTRY Price is at our sell entry, let see how it goes because if it fails then we will likely see more buys during FOMC, but I strongly believe it will sell

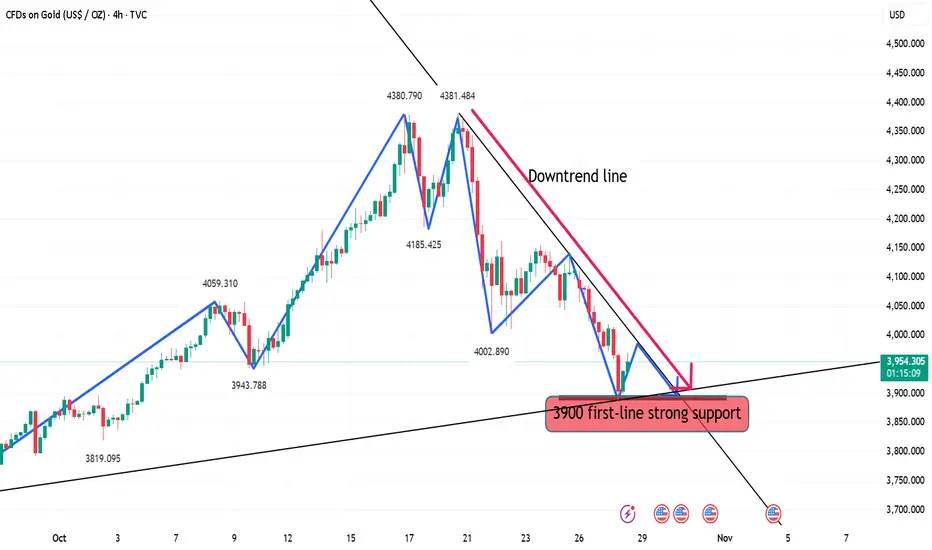
‘10.29 Buy first below 3900 and then sell!Technical Analysis:
The first resistance area above is 3960-70. Maintain a short position below this level. If the market unexpectedly breaks higher, focus on the 3995-4005 area, which remains bearish. If the market weakens, the 3945-50 area, previously the starting point for the rally, has become a source of pressure after breaking below it today.
Key support areas below are the 20-day moving average (SMA) at 3865-70 and the 50% level at 3840-45.
Trading strategy: Maintain a short position on rebounds.
Participate in the 3960-70 area, targeting a new low. After a new low, consider entering long positions based on the 20-day moving average and the 50% level.
28/10/68 : XAUUSD ( US Session )Using it from US Session until 11.00AM , I'll new analysis and update at 12.00PM
Resistance
3947-3953
3936-3942
3930
Support
3918
3907-3912
3896-3901

XAU/USD – Make-or-Break Zone Sharp 11% Drop from Record HighBeen asked to analysis GOLD on current market structure
On October 20, 2025, Gold (XAU/USD) recorded a new all-time high at $4,383, marking a historic peak in the current macro cycle. Since then, the metal has retraced sharply by nearly 11%, bringing price action back into a critical decision zone — a true make-or-break level.
This area will define the next major directional leg. A strong bounce from current support could revalidate the long-term bullish structure and initiate another run toward ATH, while a breakdown below this zone may confirm a deeper correction before the next accumulation phase.
xauusdgold has been on bulish momementum since janaury last year, and of recent it rand before given us another beautiful break of structure to 4k+, now i will like to see market see lower price before we.......

XAUUSD: Market analysis and strategy for October 27.Gold Technical Analysis
Daily Resistance: 4210, Support: 4000
4-Hour Resistance: 4140, Support: 4005
1-Hour Resistance: 4100, Support: 4015
After hitting a record high last week, gold prices have retreated, dropping over $300. Friday's close confirms the onset of a weekly downturn.
In terms of indicators, the RSI has begun to fall back below the 80 level, and on the daily chart, it has even broken through the 4050 bull-bear dividing line. The MACD fast and slow lines have formed a death cross, and the green momentum bar is declining with increasing volume. In short, it's clear that the broader cycle is quietly turning, or more accurately, the upward trend is pausing.
From the hourly chart, today's Asian session opened sharply lower. This is partly a reaction to weekend news, and partly due to the inherent weakness of the market, which requires adjustment. The subsequent rebound failed to even break the upward closing gap, and then began a rapid decline. This is the result of bearish dominance.
The 1-hour chart is currently in a bearish flag consolidation pattern. The 4000 level is likely to be retested or even broken, so today's strategy is to sell high and buy low.
SELL: near 4100
SELL: near 4140
BUY: near 4005
More Analysis →

GOLD aka XAUUSD is heading to the downside!!Last week XAUUSD (Gold) had a very bearish week! It ended its bullish streak of years and declined to the downside. It only recently broke a very strong support zone (the green trendline) and struggled to break above the resistance zone (red trendline). It should drop all the way down further all the way to the 3833 level.

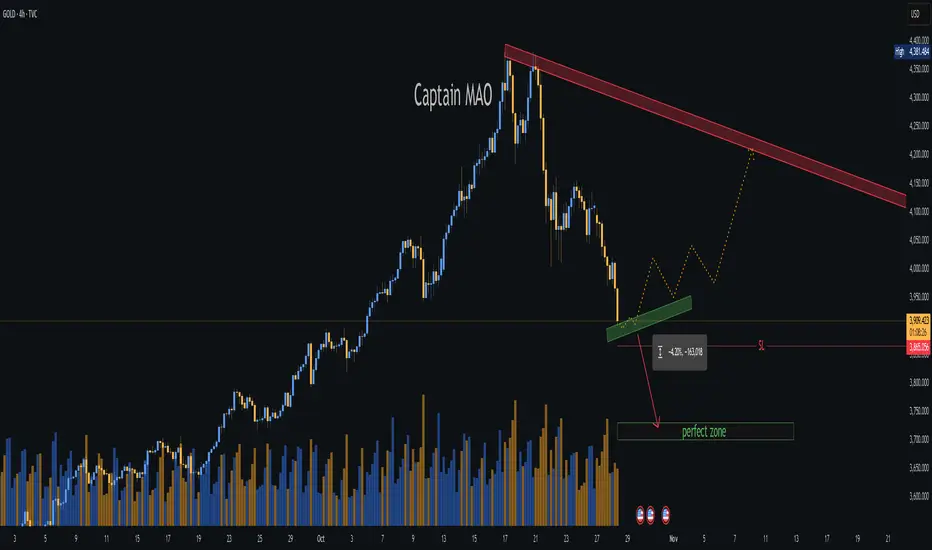
Plan |Gold Gradually Accumulating, Preparing for an Upward Wave?🔍 Market Context
After reaching the historical peak ATH GOLD 4,371 USD , gold underwent a deep correction, breaking the short-term bullish structure (BoS) and retesting the OB Bearish zone above .
However, since the price returned to the 4,040 – 4,060 USD area, the market has shown clear signs of liquidity absorption ($$$) and maintained an internal upward trendline, indicating that buying momentum is returning.
The current structure suggests gold is in a re-accumulation phase before forming a medium-term recovery wave towards the 4,185 → 4,243 USD zone.
Buyers hold the advantage as long as the price does not break the main support trendline.
💎 Key Technical Structure
Support Zone: 4,040 – 4,060 USD → a strong support zone confluencing with the trendline, where institutional buying previously appeared.
Support Trendline: connecting the series of higher lows from 15/10 → short-term trend remains bullish.
Liquidity Zone $$$: 4,060 – 4,080 → supply absorption zone, confirming its role as a “price base”.
Resistance Zone: 4,149 – 4,185 → the first resistance zone to break to confirm the recovery momentum.
Target FVG / Supply Zone: 4,243 – 4,250 → potential profit-taking area or reversal consideration point.
Current structure:
→ Short-term: bullish corrective move.
→ Medium-term: potential for forming an extended recovery wave if holding above 4,040 USD.
📈 Trading Scenarios
1️⃣ BUY Setup – Retest Trendline / Liquidity Zone 4,060 USD
Entry: 4,060 – 4,070
SL: 4,035
TP1: 4,149
TP2: 4,185
TP3: 4,243
✅ Condition:
Price hits the trendline or liquidity zone 4,060 and shows a bullish reversal signal (rejection / bullish engulfing).
➡️ This is a high-probability setup, confluencing trendline structure + liquidity zone support, often where large buyers re-enter the market.
2️⃣ BUY Setup – Break & Retest resistance zone 4,149 USD
Entry: 4,149 – 4,155
SL: 4,130
TP1: 4,185
TP2: 4,243
✅ Condition:
Wait for the price to break the 4,149 resistance zone with strong volume, then lightly retest without closing below 4,130.
➡️ Trend-following setup – confirms the return of buying momentum and extends the target to the FVG zone 4,243 USD.
3️⃣ SELL Setup (Scalp reaction) – FVG 4,243 USD
Entry: 4,240 – 4,245
SL: 4,255
TP: 4,185 → 4,150
✅ Condition:
Only execute if there is a strong reaction at FVG 4,243 without a continuation break signal.
➡️ Short-term technical sell – leveraging the supply zone reaction, not holding the position long.
⚠️ Risk Management
Prioritize trading in the buy direction, avoid selling against the main trend.
If H2 closes below 4,035 → bullish scenario invalidated, wait for a new structure.
Do not FOMO buy in the mid-range (4,090–4,130).
Keep moderate volume, move SL to breakeven when price surpasses 4,149.
💬 Conclusion
Gold is in a gradually ascending accumulation phase after a strong decline.
As long as the price holds the trendline and support zone 4,040 – 4,060 USD, gold is likely to rebound following the liquidity + breakout retest model, with the main target being 4,185 → 4,243 USD .
If it breaks through 4,243 USD, the market could trigger a stronger rally towards 4,300 – 4,340 USD .
👉 Reasonable Strategy:
Buy 4,060–4,070 → TP 4,185 / 4,243 USD
Add Buy when breaking 4,149 USD with volume confirmation.
Technical Sell 4,243 USD if there is no signal to break higher.
🔥 “As long as 4,040 holds, gold remains in accumulation — patience will pay.”
⏰ Timeframe: 2H
📅 Update: 27/10/2025
✍️ Analysis by: Captain Vincent

GOLD | Pullback Resistance AheadBased on the H4 chart analysis, we could see the price rise to the sell entry, which is a pullback resistance that aligns with the 161.8% Fibonacci extension and the 50% Fibonacci retracement, and could reverse from this level to the downside.
Stop loss is at 4,370.70, which is a multi-swing high resistance.
Take profit is at 3,946.74, which is a pullback support that is slightly above the 61.8% Fibonacci retracement.
Stratos Markets Limited (tradu.com ):
CFDs are complex instruments and come with a high risk of losing money rapidly due to leverage. 68% of retail investor accounts lose money when trading CFDs with this provider. You should consider whether you understand how CFDs work and whether you can afford to take the high risk of losing your money.
Stratos Europe Ltd (tradu.com ):
CFDs are complex instruments and come with a high risk of losing money rapidly due to leverage. 70% of retail investor accounts lose money when trading CFDs with this provider. You should consider whether you understand how CFDs work and whether you can afford to take the high risk of losing your money.


XAUUSD possible scenarios trade accordinglyI have shown possible movement that can trigger next week … I personally feel it can go 4200 and then fall below 4000 , let us see how it plays out

GOLD recovers ahead of US CPI data, key data dayArticle summary:
“Gold rebounded in the Asian session on October 24, trading around $4,139/ounce, as safe-haven flows surged amid renewed geopolitical tensions and investors awaited September US CPI data, which could determine the Federal Reserve’s monetary policy moves in the short term.
The recovery momentum was reinforced by expectations of an early Fed rate cut, along with the impact of Washington’s new oil sanctions on Russia and escalating US-China trade tensions. Meanwhile, technically, gold held support around $4,100, suggesting the medium-term uptrend remains intact.”
OANDA:XAUUSD maintained its recovery momentum in the Asian session on October 24, trading around $4,139/ounce, after rising sharply in the Thursday session thanks to the return of safe-haven flows amid fresh geopolitical developments. The move came as global markets await key US inflation data (September CPI), which is seen as key to shaping the direction of the Federal Reserve's monetary policy in the short term.
Economic data
The US Bureau of Labor Statistics (BLS) will release its September Consumer Price Index (CPI) tonight.
Forecasts show the US core CPI rising 0.3% month-on-month and remaining at 3.1% year-on-year, suggesting persistent inflationary pressures despite signs of cooling energy prices.
The market has all but priced in a 25 basis point rate cut by the Fed at its policy meeting next week. In a low-interest-rate environment, gold, a non-yielding asset, tends to benefit from lower opportunity costs.
“Gold’s goal is to continue its rally ahead of the CPI data,” says Valeria Bednarik of FXStreet.
Political and Geopolitical Events
Gold prices rebounded after the US imposed new sanctions on two major Russian energy companies, Lukoil and Rosneft. This is the first sanctions of President Donald Trump's second term and is seen as a significant escalation in the pressure campaign against Moscow.
According to Jorge Leon, Director of Geopolitical Analysis at Rystad Energy, "This move marks a major and unprecedented escalation in Washington's campaign against Russia."
The sanctions could impact global oil supplies, indirectly increasing the appeal of gold as a hedge against risks in an uncertain environment.
In addition, US-China tensions have also resurfaced as the White House considers restricting China’s use of US software, retaliating against Beijing’s rare earth export controls and raising port fees for US-flagged ships. These signals reinforce the “selective risk-off” sentiment in global markets.
In short, the current developments suggest that gold is repositioning itself in a medium-term bull cycle, as the market simultaneously assesses geopolitical risks and the prospect of Fed easing.
If CPI data reinforces the case for a Fed rate cut at the upcoming meeting, gold could retain its appeal as a key safe-haven asset in the fourth quarter.
Technical Outlook Analysis OANDA:XAUUSD
Technical analysis:
Gold prices are maintaining a technical recovery after a strong correction from the peak of 4,379 USD/ounce. Currently, the price is trading around 4,118 USD, approaching the Fibonacci support zone of 0.618 (4,110 USD), an important milestone to determine the short-term supply-demand balance.
On the daily chart, gold is still in the medium-term uptrend channel formed since mid-August, with the MA21 average line (4,000 USD area) continuing to act as a dynamic support base. RSI has reached the 50 area and is showing signs of forming a slight bottom, reflecting the weakening selling momentum.
In terms of patterns, the candlestick cluster of the last 2 days shows a "hammer - recovery confirmation" pattern, suggesting that demand is reappearing at the technical bottom.
Trend Assessment:
If the $4,100 zone holds, there is a high probability that gold will enter a bullish consolidation phase towards the $4,200 mark. However, a break of the $4,000 zone would open up a deeper correction towards the $3,950 area.
In the context of lower interest rate expectations and geopolitical tensions that have not yet subsided, the medium-term trend of gold remains bullish, although the current recovery is more technical than a fundamental breakout.
SELL XAUUSD PRICE 4221 - 4219⚡️
↠↠ Stop Loss 4225
→Take Profit 1 4213
↨
→Take Profit 2 4207
BUY XAUUSD PRICE 4057 - 4059⚡️
↠↠ Stop Loss 4053
→Take Profit 1 4065
↨
→Take Profit 2 4071

EXPECTATION FOR THE WEEK/WEEKS AHEAD Gold is in-between two major zones, buy zone at 3998-3980 and a sell zone at 4020-4037 and price can respect any of the two major zones and start moving in either direction but based on last week price action i will still go for sells, although Gold is fundamentally expected to buy again because of reduced rate and higher inflation it would probably sell again this week ahead to create the monthly low and also to test a higher time frame buy zone below before it starts with another massive buys to end the year,
so let target a sell at 4014-4020 when market opens, with sl around 4035/37 and tp not less than 500pips or far below , because this sell is expected to reach somewhere 3870-50, before the long term buy start , i will update you along the way and if it decides to buy midway i will signal or update you but if it reaches 3870-50 and it decides to move below it to sell more too i will update and that will signal a very long term sells so let be on alert mood as i always be .
A lot discovered so always be around, forex is not scary to us anymore it's rather interesting because everything is based on time and price, that's why you see prices plotted against time, very interesting indeed.

GoldXAUUSD
- Resistance Level
- Bullish Channel as an corrective pattern in Long Time Frame
- RSI - Divergence
- Symmetrical Triangle as an corrective pattern in Short Time Frame
- Completed " 12345 " Impulsive Waves and " ABC " Corrective Waves

GOLD Buy and Sell Zones for the next few weeksLong term bullish gold, short term bearish.
If we break the sell zone then we might see a new bullish momentum short term.

Bearish GoldM-Pattern formed at the top
Ascending channel formed
Bearish flag pattern formed
All technical analysis suggexts a bearish momentum waiting, gold will soon melt downwards

GoldXAUUSD
- Fair Value Gap
- RSI - Divergence
- Completed " 12345 " Impulsive Waves and " ABC " Corrective Waves
- Demand Zone
- Bearish Channel as an corrective pattern in Short Time Frame

xauusd 1h🔹 Overall Outlook and Potential Price Movements
In the charts above, we have outlined the overall outlook and possible price movement paths.
As shown, each analysis highlights a key support or resistance zone near the current market price. The market’s reaction to these zones — whether a breakout or rejection — will likely determine the next direction of the price toward the specified levels.
⚠️ Important Note:
The purpose of these trading perspectives is to identify key upcoming price levels and assess potential market reactions. The provided analyses are not trading signals in any way.
✅ Recommendation for Use:
To make effective use of these analyses, it is advised to manually draw the marked zones on your chart. Then, on the 5-minute time frame, monitor the candlestick behavior and look for valid entry triggers before making any trading decisions.

WAIT FOR BETTER ENTRY Gold is at no trade area, FOMC interrupted the buy signal yesterday so it may not to buy for long, maybe a buy to 3955 then it starts selling, the major buy will start from any moment after 1st November and if it fails then we will sell for a longer time but looking at last week CPI y/y and reduced rates yesterday the buy will likely start with momentum after November 1,
i will update it from November 1 if the buy hold or if it decides to sell more .

XAUUSD 1H Analysis (30th October 2025) ASIA/LONDON SESSION IDEAHey Guys,
BUY/SELL SCENARIOS:
BUYS:
1) Body Candle Close above the 3985.96 level.
2) Retest the failed 1h Bearish FVG at the 3985.96 level.
3) Create a 3/5m Bullish Engulfing Candle to capitalize on BUYS towards the 4139.00 level.
SELLS:
1) Retest the 1h Bearish FVG at the 3979.98 level.
2) Create a 3/5m Bearish CHOCH with a body candle close (with a FVG)
3) Retest the 3/5m Bearish CHOCH Level to capitalize on SELLS towards the 3838.00 level.
Trade smart, Trade safe, Trade according to your trading plan and don't FOMO!

Gold longGold is looking good for long.
Sl might hit, but i m going to take the risk here because it is worth i.
If we sweep PDL i will reconsider entering longs.
