XAUUSD How to become successful in forex and stock trading:
1.Master fundamentals and technical analysis.
2.Build and follow a solid trading plan.
3.Apply strict risk management (4–6% rule).
4.Stay disciplined—control fear and greed.
5.Record and analyze every trade.
6.Focus on high-quality setups only.
7.Diversify across assets and markets.
8.Keep evolving—study, adapt, and grow daily.
Trade ideas

[XAUUSD] Market OutlookAs we saw in the previous outlook, the market reacted perfectly to the marked zone.
Given this reaction and further analysis, we can notice that on the Daily timeframe there’s an internal Supply zone that could cause some trouble.
If that Supply level gets strongly broken, then I’d look for a structural realignment to the upside after a retest of the impulse.
So I’d wait for a full break of the Supply, followed by a move similar to the one shown in the picture .
Personally, I’d prefer scenario 1 for a structural continuation, but the second scenario could also offer the chance to buy gold at more “discounted” prices.
Be patient, no rush.

28/10/68 : XAUUSD ( Europe / London Session )Using it from Europe Session until 7.00PM , I'll new analysis and update at 8.00PM or watch streaming at 7.00PM on YouTube Channel : @tradebynon
Resistance
3988-3993
3978-3983
3973
Support
3961
3950-3955
3939-3945

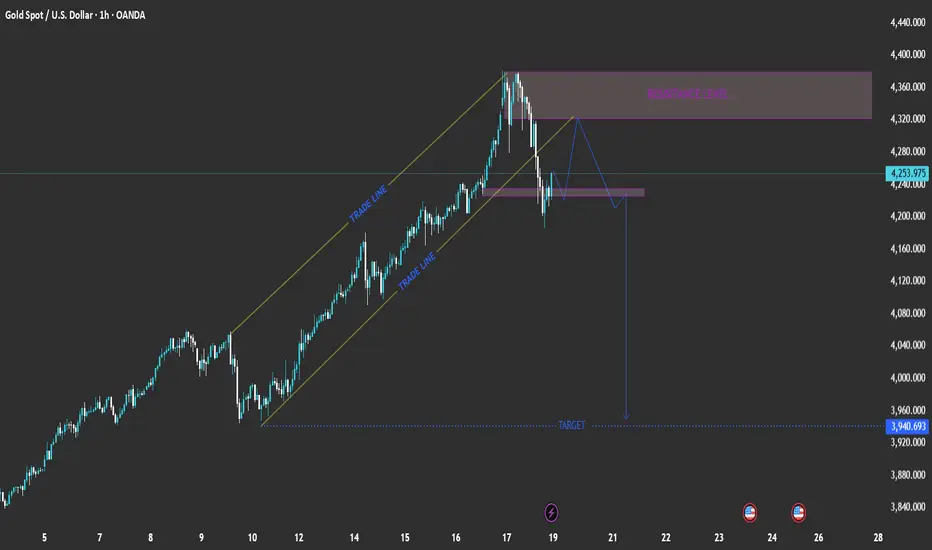
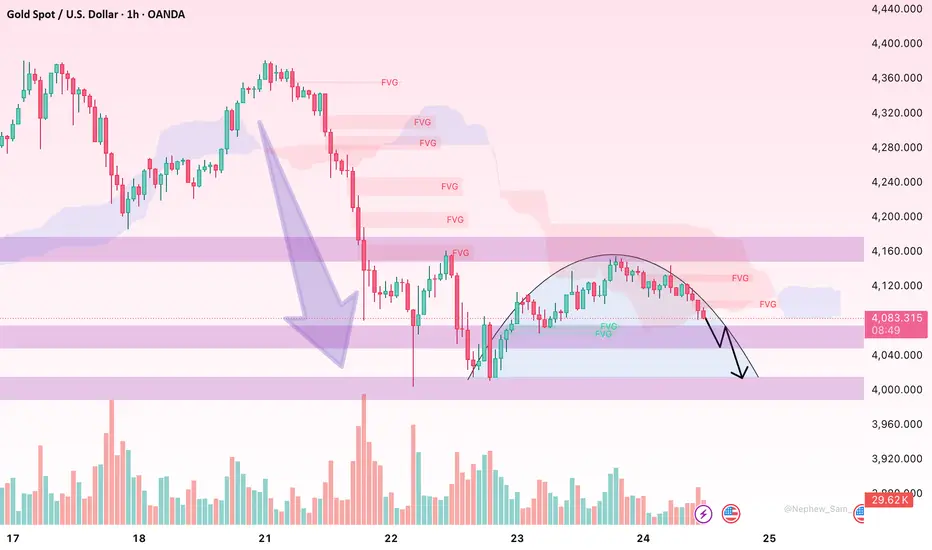
XAU/USD: Channel Breakout → Retest → Downside Target at 3,940EURONEXT:FTI1! EURONEXT:FTI1! EURONEXT:VU8F2026 EURONEXT:VM81! EURONEXT:VV6X2025 EURONEXT:V26X2025 EURONEXT:NS8Z2025 EURONEXT:YG8F2026 Pair: Gold Spot (XAU/USD)
Timeframe: 1-hour
Current Price: 4,253.975
Trend: Recently broke out of an ascending channel (bearish signal)
📉 Chart Breakdown
1. Ascending Channel (Trade Lines)
Price was moving steadily inside a rising channel, indicated by the two parallel yellow “TRADE LINE” levels.
The break below the lower trade line suggests weakening bullish momentum and potential trend reversal.
2. Resistance Level (4,320 – 4,360 zone)
Marked in purple, this zone served as a key resistance.
Price rejected strongly from this area, confirming seller presence.
3. Structure Retest and Potential Move
After the channel break, price retraced back to retest the broken channel support (now resistance).
The projected blue path shows a lower-high formation followed by a new drop, completing a bearish continuation pattern.
4. Target Zone
The projected target is near 3,940.693, aligning with previous structure support.
This level could serve as a profit-taking area for short positions.
📊 Summary of Key Levels
Zone Type Range / Level
4,320 – 4,360 Resistance Strong supply zone
4,220 – 4,240 Retest zone Potential short entry area
3,940 Target Bearish target / demand zone
⚙️ Trading Plan Concept (Hypothetical)
Bias: Bearish
Entry Idea: Wait for rejection from 4,220–4,240 zone.
Stop Loss: Above 4,280 (resistance)
Take Profit: Around 3,940 (target)
Risk/Reward: Approximately 1:3 or better
🧭 Conclusion
The chart suggests that Gold (XAU/USD) might be entering a corrective bearish phase after failing to sustain its bullish channel. A retest of broken structure before another drop aligns with typical market structure behavior.
XAUUSDRisk warning, disclaimer: the above is a personal market judgment based on published information and historical chart data on Tradingview, all analysis is only subjective. Hope investors consider, that I am not responsible for your investment decision.
Thank you.
Good luck

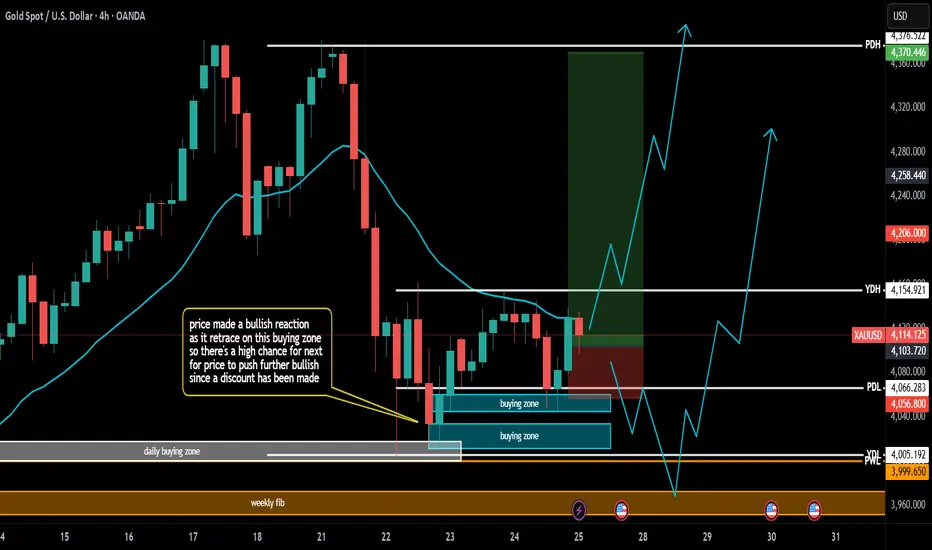
Weekly Analysis on GoldFor next week i will hold my buy position and modify it once it runs in profits. If it get stop out then i will wait for further information from the candles until it shows a possible bullish run again. I am looking for buys since gold is still in a strong bullish trend. If the market shows a chance for taking a sell going to weekly fib zone then i will execute a trade with lesser risk and ride the move to the weekly fib zone.
Gold CompressionGold has made a strong move in 2025, with a high recently of 4381.44.
We can see a consolidation of price following the Tariff Tantrum from April to August 2025, into an ascending triangle. This is reflected in the ATR contracting , momentum moving to its base and RSI hovering around the midlevel.
Following this base, a strong impulse propels price over 1000 USD in a matter of weeks. The RSI sits perpetually in the Oversold region and the ATR more than doubles.
The parabolic move ended with a 5 sigma day on Tuesday as the Bears stepped in. The remainder of the week sees Gold staying above the 4000 level.
Where from here ?
The market can breath out by either expending price or time. Given the fundamental background of Dollar Debasement, Dedollarization, Gold Consumption by Central Banks and Brics initiatives, it is likely Gold moves into consolidation from here into early 2026.
Support - offered by the 50 MAV and Fib 50-61.8 levels.
Target - 5000 beyond Q1 2026.

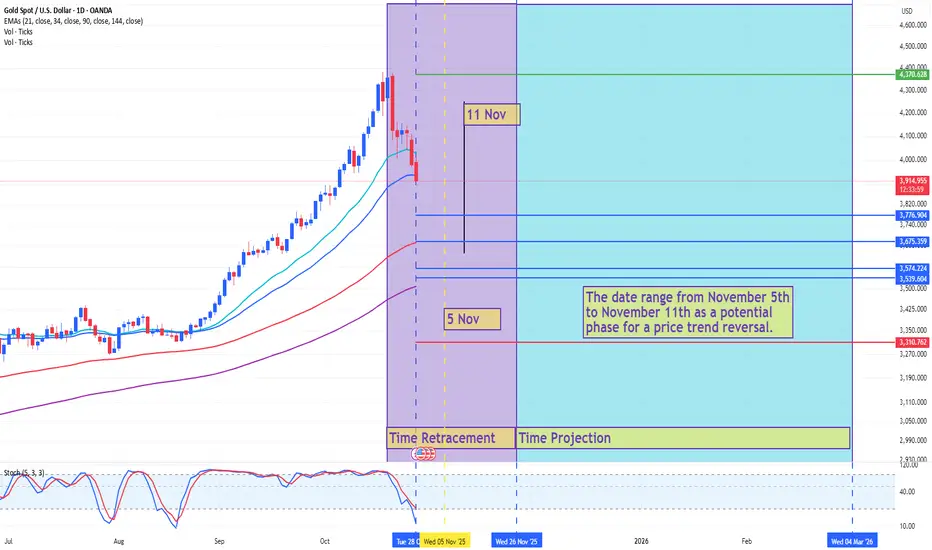
GOLD[1D] Trading Ideas: Fibonacci Time ProjectionGold Timing Analysis: Fibonacci & Lunar Confluence Signals Potential Reversal (Nov 5–11, 2025)
Fundamental:
-
Technical Analysis:
Combining Fibonacci Time Projection with the Lunar cycle to identify a critical turning window.
Note:
The analysis will remain relevant if the latest market data continues to align with this outlook.
IDX:COMPOSITE
XAUUSD (Gold) seeking $4,000 region?As my H4 chart shows, gold did make a double top a few days ago and then crashed. You can give credit for this massive 3,800 points move to profit taking or economic uncertainty or any technical reason, maybe a combination but it really does not matter.
What does matter is that we now have a double or triple top indicating that we have more room to the down side. I am seeing a medium term bearish move followed by a consolidation and now it may be that we will get a breakout (to the down side) to give us a bearish continuation.
How far will we go? I have no idea but the round number 4,000 followed by 3,950 do make sense. If all this works out as I anticipate, it may be a good idea to close a partial position, move the stop to a level of small profit and then trail the price action.
This is not a trade recommendation; it’s merely my own analysis. Trading carries a high level of risk so carefully managing your capital and risk is important. If you like my idea, please give a “boost” and follow me to get even more.

Gold Intraday – Oct 30 (No.1)Scalping setup based on early London session volatility.
Expecting rejection near 2380 and possible short fade toward 2370 zone.
⚠️ Quick play — not advice, just sharing my intraday view.

Elliott Wave Analysis – XAUUSD | October 30, 2025
1️⃣ Momentum
• D1 Timeframe:
D1 momentum remains entangled. Yesterday’s daily candle closed at its lowest point, rejecting all intraday bullish attempts. However, it has not yet broken the previous candle’s low — this suggests that the bearish trend is still intact, though weakening, and a potential reversal could occur within the next 1–2 days.
• H4 Timeframe:
H4 momentum is approaching the oversold zone, indicating a possible short-term recovery lasting around 4–5 H4 candles.
• H1 Timeframe:
The price is currently either consolidating or continuing its short-term decline.
If it continues to cling to the 3927 liquidity zone, a further breakdown is likely.
________________________________________
2️⃣ Wave Structure
• D1 Timeframe:
Price is now sitting near the 0.382 Fibonacci retracement of wave (3) in yellow — a typical correction level for wave (4).
Therefore, if the decline continues or the correction extends, it’s highly probable that we are in wave (4) of the yellow count, and the current drop is only the first sub-wave of this corrective phase.
• H4 Timeframe:
Currently, price is around the 0.872 extension of wave (3) in purple, which is not ideal for a completed wave (4).
When combining the D1 and H4 structures, both indicate that the market is likely forming a corrective wave (4) in yellow, and a recovery move may soon appear as D1 momentum begins to turn upward.
👉 If this scenario is confirmed:
o If price breaks above the previous wave (3) high (around 4400), it would confirm the start of a new impulsive wave upward.
o If price rises slowly and the highest target only reaches around 4400 before turning down again → this move is likely part of the corrective wave (4) before another bearish leg resumes.
• H1 Timeframe:
The current formation suggests a potential double zigzag structure.
To confirm this setup, price needs to break below 3892. This is a strong liquidity zone, so if price reaches it, a temporary bounce could occur.
Key liquidity zones above to watch: 3927 – 3953 – 3995.
If price fails to break above the previous red wave X, these zones may act as strong resistance levels, pushing the market lower again.
Target areas for the red wave Y are:
o 3814
o 3786
________________________________________
3️⃣ Trade Plan
Scenario 1:
• Buy Zone: 3815 – 3813
• SL: 3804
• TP1: 3892
Scenario 2:
• Buy Zone: 3787 – 3785
• SL: 3776
• TP1: 3892
________________________________________
📌 Summary:
D1 momentum is weakening and nearing the oversold zone → a potential bullish rebound could develop in the coming sessions.
The 3815 – 3785 area remains a key buy zone, while 3927 – 3995 should be closely monitored as resistance levels to confirm the next directional move.

XAU/USD - Structural Reset and Reversion to Major Sell FrameworkThe recent bullish attempt has officially failed to establish structure, revealing that the brief upward move was merely a corrective exhaustion from the previous selling leg. Despite the short-term relief, momentum quickly reverted, and a new sell-side framework has now formed - one that’s far more aligned with broader structural behavior.
This new formation mirrors the previous major sell triangle, but with a more refined and realistic target zone, highlighted by the purple box. Price remains positioned near the upper boundary of the red structure, suggesting that selling pressure is once again dominant.
Unless buyers can produce a confirmed break above the current structural pivot, the path of least resistance remains to the downside, with measured targets pointing toward the completion zone inside the new sell continuation area.
In short - the market has reset its rhythm. The unstructured pump has faded, and the primary bearish structure is back in control.

Buy Pressure Building on GoldGold is displaying signs of buyer re-entry after a period of controlled downside movement. The recent liquidity sweep around the lower range indicates that short-term selling pressure has been largely absorbed, creating favorable conditions for a potential upward expansion.
Market activity suggests renewed interest from institutional participants accumulating within the current price zone. The consolidation phase appears to be forming a base, signaling the possibility of a directional shift as liquidity gradually migrates upward. Increasing momentum on the lower end of the range reflects confidence returning to the market, setting the stage for a possible continuation toward higher valuation areas.
The outlook remains constructive as long as current accumulation behavior sustains, with market sentiment leaning toward a recovery-driven advance in the near term.

XAUUSD: October 28th Market Analysis and StrategyGold Technical Analysis
Daily Resistance: 4005, Support: 3840
4-Hour Resistance: 3972, Support: 3840
1-Hour Resistance: 3950, Support: 3880
Divergence in technical indicators continues to intensify. After the weekly K-line price of spot gold falls below 4000, the next support level is near the 10-day moving average (MA10) around 3840.
The daily K-line shows a temporary peaking signal, intensifying short-term market sell-off sentiment. After breaking below the 3950 support level, the market trend has shifted. The next target is the 3800/3700 level.
Based on the 1-hour chart, gold generally conforms to yesterday's analysis. After the K-line combination broke through the trend support, the downward trend accelerated. The decline widened in the European session, with the price falling below the 3900 mark! Bulls' last hope lies in Thursday's Federal Reserve interest rate decision. Sell on rallies in the near term.
SELL: 3930-3945
BUY: 3835-3845

Trading plan for XAUUSD for 10/27/2025 (short)This trading plan is :
- If the price gets below $4065 then enter short with TP = $4005 (around recent lower low).
- if the price gets below $4005 then enter short with TP = $3946 (around recent lower low).
- if the price gets below $3946 then enter short with TP = $3873 (fibonacci level).

XAUUSD Weekly Technical Forecast: Deep Dive AnalysisTraders, gear up for a pivotal week in Gold! As of the close at 4,112.84 on Oct 25th , XAUUSD is at a critical juncture. This analysis blends classic theory with modern indicators for intraday swings and positional trades. Bulls and bears are in a fierce battle ⚔️.
The stage is set for a significant volatility expansion. The key is to identify the dominant auction.
🎯 1D & 4H: The Swing Trade Panorama (Swing Bias)
The higher frames dictate the primary trend. The 1D chart shows a potential completion of an Elliott Wave corrective pattern (ABC) , suggesting a new impulsive wave up may be imminent.
Dow Theory : Higher highs & higher lows remain intact on the 1D, confirming the primary uptrend. ✅
Wyckoff Theory : We appear to be in a 'Spring' or 'Sign of Strength' phase after a re-accumulation period around the 4,080-4,100 zone.
Ichimoku Cloud : Price is trading above the Kumo (cloud) on 1D, a bullish bias. The Tenkan-sen (blue line) is a key dynamic support.
Key S&R : Major support rests at 4,080 (previous resistance, 50 EMA). Resistance is at the recent high of 4,140 .
A decisive 4H close above 4,130 could trigger a Bullish Breakout 🚀 targeting 4,180-4,200. Conversely, a break below 4,080 on high volume could see a drop to 4,040.
⏰ Intraday Focus: 1H, 30M, 15M, 5M (Intraday Bias)
For intraday action, lower timeframes offer precision entries.
Harmonic & Gann Theory : A clear Bullish Bat Pattern has potentially completed on the 1H chart. The PRZ (Potential Reversal Zone) aligns perfectly with the 4,100-4,105 support. Gann's 50% retracement level from the last swing up also converges here.
Bollinger Bands (20,2) : On the 1H/4H, price is hugging the upper band, indicating strong momentum. A squeeze on the 30M chart suggests a volatility expansion is due.
RSI (14) : On the 1H, RSI is in the 55-60 range, showing healthy momentum without being overbought. Watch for bearish divergence on a new high as a reversal signal.
VWAP & EMA Confluence : The 20 and 50 EMAs are providing dynamic support on pullbacks. For day trades, the VWAP on the 15M/5M charts will be your best friend for trend alignment. Long above, short below.
🚦Trade Plan: Entries, Exits & Risk Management
Identifying reversals is key. Use Japanese Candlesticks at key S&R levels. A bullish engulfing or morning star pattern at the 4,100 support, confirmed by a rising volume spike, is a high-probability long signal.
Swing Long Entry : On a 4H close > 4,130, or a pullback to 4,100-4,105 with bullish confirmation.
Swing Short Entry : On a 1D close < 4,080, targeting 4,040.
Intraday Long : Buy on a bounce from VWAP/20 EMA on the 15M chart with RSI > 50.
Intraday Short : Sell on a rejection from the 4,125-4,130 resistance with a bearish RSI divergence.
Stop-Loss : Always 15-20 pips below/above your entry trigger candle.
💡The Bottom Line:
The bullish structure is favored as long as 4,080 holds. The confluence of Harmonic patterns, Wyckoff accumulation, and bullish Ichimoku alignment points to a potential leg higher. However, respect the levels. A break below support will invalidate the bullish thesis.
Track these charts live:
1D:
4H:
1H:
30M:
15M:
5M:
⚠️ Disclaimer: This post is educational content and does not constitute investment advice, financial advice, or trading recommendations. The views expressed here are based on technical analysis and are shared solely for informational purposes. The stock market is subject to risks, including capital loss, and readers should exercise due diligence before investing. We do not take responsibility for decisions made based on this content. Consult a certified financial advisor for personalized guidance.

XAUUSD UPDATE : Alert ! BEARISH PRESSURE still EXISTMonday open, price still under pressure below 4161 resistance.
It could be the early sign for 4160 - 4150 level as a strong resistance area, and price have a big possibility to make a downside continuation / more correction to a lower price below 4000.
Becareful for a retest action !
Have a great week ahead !

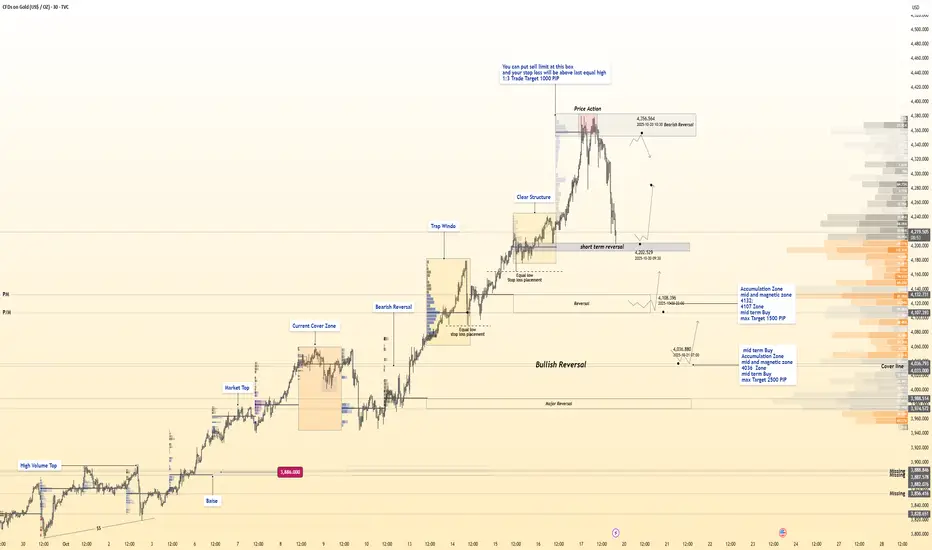
The Ultimate GOLD Reversal Map📊 Hanzo Protocol Note
Every marked level reflects precision between liquidity, delta reaction, and volume logic —
Only structure and flow decide — not bias.
Mid-Term SELL Zone — 4360
Setup: Limit Sell Recommended
Stop Loss: Above recent equal highs
Target: +1000 Pips (1:3 RR)
Reasons:
Liquidity pool above previous equal highs
Institutional distribution volume at upper range
HVN (High Volume Node) cluster acting as resistance wall
Delta shift showing heavy sell absorption
Imbalance re-test aligned with order block
4H premium pricing zone within range top
Price deviation above value area high
Stop hunt confirmation wick
Momentum divergence vs delta
Hidden distribution footprint visible on volume profile
Short-Term BUY Zone — 4202
Setup: Reactive Buy Opportunity
Target: 500–1000 Pips
Reasons:
Ultra-volume spike with no price continuation
Delta flip confirming buyer absorption
Trap formation below session low
Volume exhaustion beneath POC
Smart Money re-entry point after sell-side clear
Strong 30M reversal wick with liquidity gap
Reaction from prior fixed HVN
Internal structure shift with micro CHoCH
Buyer cluster confirmed under equilibrium
Perfect liquidity grab setup before new leg
Mid-Term BUY Zone — 4132 – 4107
Setup: Accumulation & Magnetic Demand Area
Target: Up to 1500 Pips
Reasons:
Multi-session HVN alignment
Strong accumulation footprint on delta flow
Reactive rejection at discounted price zone
Liquidity engineered below equilibrium
Large volume imbalance correction
Compression channel breakout origin
Major liquidity gap filled
High-probability reversal range from fixed profile
Delta divergence showing quiet buyer absorption
Institutional order flow detected at low volume shelf
Long-Term BUY Zone — 4036
Setup: Deep Accumulation Zone
Target: Up to 2500 Pips
Reasons:
Major 4H structural base confirmed
Deep liquidity flush below quarterly low
Volume absorption + delta compression zone
Institutional reloading pattern visible
Smart Money demand block within discount 0.79 level
Magnet zone aligning with historical POC
Strong rejection from fixed range low
Major delta shift to positive
Buyer footprint expansion in lower volume node
Final liquidity grab before long-term accumulation move


Technical Correction – Bullish Structure Remains IntactHello everyone, after a strong rally to new highs, gold (XAU/USD) is entering a necessary corrective phase before deciding its next direction. On the H1 timeframe, price is temporarily consolidating around $4,090 – a key support area where buyers are beginning to show signs of defence.
From a technical perspective, the overall bullish structure remains intact as price continues to form liquidity zones followed by FVG fills. The $4,090–$4,080 zone still acts as the short-term defensive line for buyers. If this area holds, gold may rebound to retest $4,120–$4,130 – a region where selling pressure previously intensified. Ichimoku Cloud remains below price and has yet to signal a bearish reversal, indicating that this move is still a correction rather than distribution.
On the news side, gold continues to receive medium-term support from expectations of a Fed rate cut in December, a cooling US dollar, declining bond yields and lingering geopolitical risks. While US–China trade dialogue may offer temporary signs of easing tension, institutional capital still favours defensive positioning, keeping gold within its broader uptrend.
In the short term, I prioritise the scenario of gold extending its correction to gather liquidity around $4,080–$4,090 before potentially resuming its upside. Only a decisive break below this zone with strong bearish momentum would expose the psychological level at $4,000.
What do you think about gold’s current trend – is this just a healthy pullback or an early warning of a deeper decline?
Elliott Wave Analysis – XAUUSD (October 28, 2025)
🔹 Momentum
D1 Timeframe:
The momentum lines on D1 remain intertwined. When this happens, the trend often continues with candle counts that follow Fibonacci numbers (3, 5, 8…).
Currently, there are around 3 candles, indicating a high probability of a reversal forming soon, possibly today.
H4 Timeframe:
Momentum is rising, suggesting a potential short-term upward or sideways move to push momentum into the overbought zone.
If the market consolidates at this level, once momentum reaches the overbought region, another bearish leg on H4 could still occur.
H1 Timeframe:
Momentum is currently decreasing. Price is closing lower around the liquidity zone at 3994, showing signs of a liquidity sweep.
We expect price to continue moving lower toward the next liquidity zone, in alignment with the short-term bearish structure on H1.
________________________________________
🔹 Wave Structure
D1 Timeframe:
The overall wave structure remains largely unchanged. Yesterday’s strong bearish candle fits within our prior analysis, confirming that the corrective wave is still in progress.
However, since the D1 momentum lines have already stuck together for about three candles, a potential bullish reversal candle today could mark the completion of this correction.
H4 Timeframe:
The structure has broken the previous low, suggesting that this could be the final leg of wave Y (blue).
Observing the completed 5-wave structure (1–2–3–4–5 in blue), this corrective leg has now returned to the base of the previous wave 4, achieving both price and time symmetry.
→ A short-term bullish reversal is expected from the current area.
H1 Timeframe:
The prior correction formed a triangle pattern (abcde in red), which has now broken to the downside, developing into a 5-wave sequence (black).
Wave 4 (black) appears completed, and price is likely within the final wave 5 down.
🎯 Target zones for completion of wave 5 (black):
• Target 1️⃣: 3953
• Target 2️⃣: 3927
________________________________________
🔹 Trading Plan
Scenario 1:
• Buy Zone: 3955 – 3952
• Stop Loss: 3932
• TP1: 4050
Scenario 2:
• Buy Zone: 3939 – 3927
• Stop Loss: 3907
• TP1: 3994

XAUUSD Delivered Excellent profits [ 1500 pips in single Day ]
Today I gave 2 Buy setups on mine in Early EU session and 2nd on N.y session.
As I mentioned in today’s commentary session:
• I took buy trades around 3930 & 3940 area
My Tp was 3990 & 4010 , Both Targets went successfull.
Secondly I gave another setup As always ,My strategy was to buy the dips, I took buy trades from 3967-3972 area and hold it 4010 - 4020.
I’m very happy with the profits so far – .
My medium-term target 4120 is achieved, Alhamdulillah. And I'm looking for new setup now towards ATH.
Thanks to those who followed, trusted me, and made profits.
