SOFI set to rally on earningsNASDAQ:SOFI is set to rally on earnings. Here are the signs:
1. 4 Hr chart shows succecssful breakout and restest of triangle around the IPO price 28.26, followed by a continuation gap up on Monday.
2. 4 Hr chart shows the x pivot of the WXY triangle wave 2 correction at 30.09 has been overtaken.
3. Upside targets: the RSI on the Daily chart shorts the recent high was not wave (3), but another 1-2 nesting within the larger wave (3). Price will reach AT LEAST Fib 1.618 extension (possibly 2.212 or 2.618) of (1)-(2), which is 109 and 161.
Trade ideas

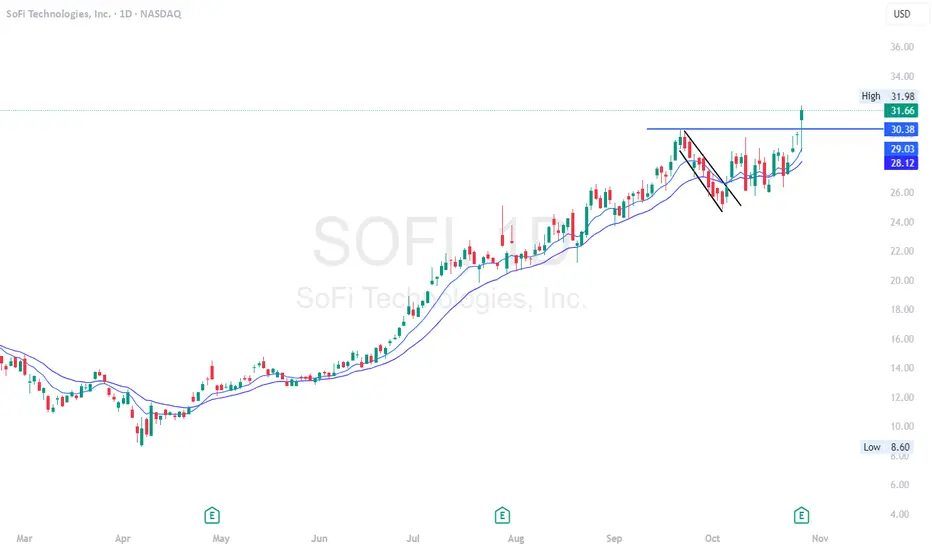
SOFI — Bullish Breakout with Strong VolumeSOFI has broken out to a new all-time high with strong volume, signaling strong buying pressure and renewed bullish momentum.
The stock remains in a clear uptrend, trading above the 50-day EMA. Recently, SOFI rebounded perfectly at the EMA 50, confirming it as a strong dynamic support zone. The bullish pennant pattern breakout further strengthens the case for a trend continuation.
The uptrend line is still intact, and as long as the price holds above the EMA 50, the bullish outlook remains valid.
Entry Price : 31.00 - 32.00
Stop Loss: Below EMA 50 (~26.80–26.90)
Targets: 35.00 and 38.00

$SOFI - $40 possibleSOFI - Stock breaking out and hitting all time highs. long calls printing. looking for more calls above $32 for a move towards $35 and $40. Stock looks strong on charts and indicator.
Triangle Break Heading into EarningsNASDAQ:SOFI Forming a big symmetrical triangle on the daily timeframe heading into earnings. EMA's are starting to curl upwards after NASDAQ:SOFI found some support on its 50-day SMA. Bullish long-term on NASDAQ:SOFI , so definitely will be watching this one closely
Breaking: SoFi Technologies, Inc. (SOFI) Surge 4% In PremarketSoFi Technologies, Inc. (NASDAQ: NASDAQ:SOFI ) spike 4% in Tuesday's premarket session but sharply consolidated 2.62% .
The daily price chart shows a cup and handle pattern with eyes on the $40 resistant. As of the time of writing, NASDAQ:SOFI has an RSI of 54 giving more room to capitalize on the RSI.
In another news, SoFi Reports Third Quarter 2025 with Record Net Revenue of $962 Million, Record Member and Product Growth, Net Income of $139 Million.
About SOFI
SoFi Technologies, Inc. provides various financial services in the United States, Latin America, Canada, and Hong Kong. It operates through three segments: Lending, Technology Platform, and Financial Services.
The company offers lending and financial services and products that allows its members to borrow, save, spend, invest, and protect money; and personal loans, student loans, home loans, and related services.

SOFI Weekly Outlook (Oct 21–25): Momentum ReloadBulls Eye $30 as Gamma Pressure Builds 🚀
📆 Daily Chart — Macro Structure and Bias
Market Structure:
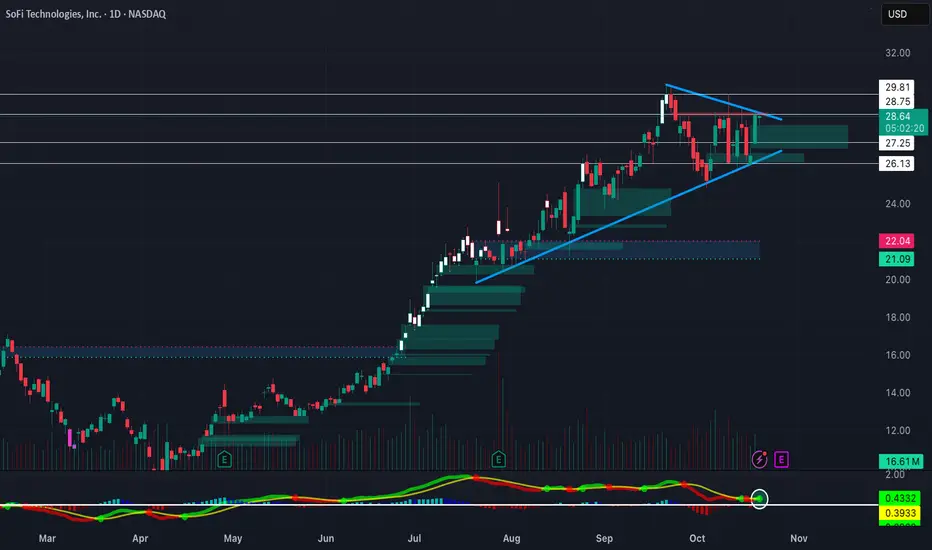
SOFI continues to respect its long-term ascending channel that’s been intact since the May reversal. The most recent correction held firmly at $24.80, forming a clean higher low — classic accumulation behavior from institutional players. We’ve now seen a Break of Structure (BOS) above $28.50, confirming a potential continuation leg within the channel.
The daily candles show price regaining control above both EMAs and compressing just below the mid-channel resistance. That tells me bulls are gradually reloading after shaking out weak hands during the $25–$26 liquidity sweep.
Supply & Demand / Order Blocks:
* Major Demand Zone: $24.50–$25.00 (base of the previous bullish order block and channel support).
* Current Support: $27.80–$28.50 (recent OB retest).
* Supply Zone: $30.35–$31.00 (channel resistance and prior August high).
A breakout daily close above $30.35 would create a macro BOS and open potential upside to $32–$33, where the next liquidity pool sits.
Indicator Confluence:
* 9 EMA vs 21 EMA: Bullish crossover with the 9 EMA starting to curl upward.
* MACD: Histogram turning positive after extended red fade — early momentum shift.
* Stoch RSI: Rising from mid-range (50–60) toward 70, suggesting energy building before another push.
* Volume: Gradually increasing on up days, consistent with healthy accumulation.
The daily structure favors bullish continuation if $28.50 continues to hold as the higher low pivot.
⏱️ 1-Hour Chart — Short-Term Trend and Key Swing Zones
Market Structure:
After multiple CHoCH signals from the descending structure last week, SOFI confirmed a clean BOS at $27.20, breaking out from its falling wedge. The 1-hour structure has now transitioned decisively bullish, forming higher highs and defending higher lows.
Price action is currently consolidating above $28.60–$28.90, which also aligns with the 1-hour 9 EMA — acting as dynamic support. The next leg higher targets the $29.80–$30.40 region, where prior liquidity and the upper gamma wall converge.
Supply & Demand / OB Zones:
* Demand: $26.50 (prior CHoCH base).
* Fresh OB: $28.40–$28.60 (new accumulation block).
* Supply: $29.80–$30.35 (liquidity & resistance cluster).
Indicator Confluence:
* 9 EMA > 21 EMA with widening gap — healthy bullish momentum.
* MACD: Strong positive crossover, expanding histogram showing trend strength.
* Stoch RSI: Hovering above 80, suggesting extended strength but near short-term overbought; pullbacks to EMA likely get bought.
* Volume: Expansion during up candles → confirms conviction, not just low-liquidity drift.
Trade Scenarios:
* Bullish Setup: Enter near $28.50–$28.70 → Target $29.80 / $30.35 → Stop $27.40.
* Bearish Setup: If rejection at $30.35 with divergence → Target $28.80 / $27.80 → Stop above $30.60.
I’ll be watching how the 1-hour candle behaves at $30 — a clean break could start a new expansion cycle.
🕒 15-Minute Chart — Intraday Momentum and Scalping Zones
Market Structure:
SOFI’s 15-minute chart shows tight consolidation after a strong CHoCH and BOS confirmation above $27.00. Each dip into $28.40 has been defended with increasing volume — the hallmark of intraday accumulation. Liquidity sweeps beneath the minor intraday OBs have triggered fast reversals, suggesting strong algo buying activity.
Supply & Demand / OB Levels:
* Demand Zone: $28.40–$28.60 (micro OB from previous breakout).
* Supply Zone: $29.00–$29.40 (short-term resistance and liquidity pocket).
Indicator Confluence:
* 9 EMA vs 21 EMA: Bullish alignment, both rising steeply.
* MACD: Momentum expanding upward with consistent histogram growth.
* Stoch RSI: Cycling around 70–85 — bullish but nearing short-term exhaustion.
* Volume: High-volume nodes appear on breakouts, confirming real participation.
Scalp Plan:
* Bullish Bias: Buy dips near $28.40 → Target $29.10 → $29.50 → $30.00 → Stop below $27.90.
* Bearish Bias: If $29.80 rejects twice → Scalp short to $28.80 → Stop $30.20.
The intraday bias stays bullish as long as we’re above $28.40; below that, momentum cools into a neutral range.
📊 GEX (Gamma Exposure) & Options Sentiment Overview
SOFI’s options positioning supports the bullish technical picture. Dealers are increasingly exposed to positive gamma near $29–$30, effectively pinning price in this range as hedging flows compress volatility.
Key GEX Levels:
* Highest Positive Gamma: $29.80–$30.00 (dealer magnet zone).
* Major Call Walls: $29.00 and $30.00 (likely short-term tops).
* Put Support: $26.50 (first defensive wall) and $25.00 (deep gamma cushion).
* IVR: 45.7 — moderate, indicating balanced option pricing.
* Call Flow: 59.8% of all volume favors calls, consistent with institutional hedging toward the upside.
If SOFI can break and hold above $30.35, we could see a gamma expansion — a short-term squeeze triggered by dealers buying to hedge rising delta exposure. Conversely, rejection below $30 may cause temporary reversion to $27–$26.5 before reaccumulation.
🎯 Closing Outlook
The broader setup across all timeframes points bullish into the week of October 21–25. SOFI is steadily regaining strength within its long-term uptrend, and the gamma positioning supports further expansion toward the $30 zone.
As long as $28.40–$28.60 holds, dips are opportunities — not breakdowns. If bulls clear $30.35 with conviction, it could spark the next leg into $32+.
I’m watching closely for a liquidity trap around $29.80–$30.20. If bulls absorb that region and hold, it’s game on for a gamma-fueled continuation.
Disclaimer:
This analysis is for educational purposes only and not financial advice. Always do your own research and manage your risk.
Buy when its still CHEAPClassic Cup-and-Handle Breakout NASDAQ:SOFI
The chart is showing a textbook cup-and-handle pattern, one of the strongest bullish continuation signals in technical analysis. SoFi pushed through years of long-term resistance with surging volume, then consolidated neatly at highs (the “handle”)—the perfect recipe for an explosive follow-through toward higher targets. For cup-and-handle setups, the typical measured move is calculated by adding the depth of the “cup” to the breakout level.
Powerful Earnings Momentum
Latest earnings showed 29.7% year-over-year revenue growth and a remarkable 33.9% customer expansion, beating consensus and showcasing market share gains even while many fintechs struggle. Net profit margin leapt to 18.9%, annual fee-based revenues soared above $1.5 billion, and SoFi continues to outpace the rest of the market in both top- and bottom-line growth. Their diverse, scalable business model and rapid cross-sell rates underline robust, sustainable expansion.
Sentiment and Valuation Setup
Despite the rally, consensus price targets still lag behind current momentum, creating room for upgrades as Wall Street catches up with the company’s transformation. SoFi’s strong member growth, leading technology, and relentless execution are rapidly re-rating its valuation profile. As technical buying converges with surprising fundamentals, a major breakout scenario is materializing.
Bottom line: The stars are aligning—technicals are bullish, earnings are surging, and sentiment is shifting. SoFi is breaking out of a massive base, and $40 could arrive faster than most expect.

SOFI before Earnings – TuesdayI’ve been tracking NASDAQ:SOFI closely since the last earnings report, and honestly, I like what I’m seeing.
Despite the overall market volatility, the stock has held a solid structure and stayed in a tight range, which to me signals institutional confidence, not weakness.
We haven’t seen any heavy selling or major breakdowns, and that tells me smart money is still inside, waiting for Tuesday’s catalyst.
On top of that, SoFi’s recent investments seem to be paying off, because the stock hasn’t followed the broader market pullbacks.
That gives me the sense that the market is already recognizing an improvement in the company’s fundamentals.
In my opinion, SoFi could surprise to the upside this time.
If the numbers come in strong — especially the forward guidance — we might see a clean breakout of this range and a solid move higher in the next sessions.
Obviously, manage your own risk, but to me the stock is showing clear signs of accumulation and strength before the report.
👁️🗨️ Levels I’m watching:
Support: $28.70
Key zone: $29.80 – $30.10
Breakout confirmation: above $30.50
🎯 If earnings impress, I wouldn’t be surprised to see it push toward $32–$34.

SOFI EARNING OCT -2025SOFI 4H:
Rejected ~30.5 supply (7.8B sold).
Gap 27.8.
Upside tgt 35.
Downside tgt 25–24; backup 22.8 (EPS). #SOFI
#SOFI #globaltrade #investment #investing #stockmarket #wealth #realestate #markets #economy #finance #money #forex #trading #price #business #currency #blockchain #crypto #cryptocurrency #airdrop #btc #ethereum #ico #altcoin #cryptonews #Bitcoin #ipo


Is SOFI Setting Up for a Bullish Reversal Play?🚀 SOFI TECHNOLOGIES INC. (SOFI) — Stock Market Profit Playbook
Strategy Type: Swing / Day Trade
Bias: Bullish Pullback Plan confirmed with 0.786 Hull Moving Average
🧠 Trading Thesis
SOFI is setting up for a bullish pullback confirmation around the 0.786 Hull MA zone.
The idea is simple: wait for price to dip, confirm structure, and then scale in using the Thief Strategy — a multi-layer limit entry approach that lets us catch the bounce with precision.
This setup looks for continuation toward key resistance where profit-taking zones align with overbought conditions and potential traps.
💰 Entry Plan (Thief-Style Layering Strategy)
The Thief Strategy uses multiple buy-limit layers to enter a position smoothly during retracements.
Here’s the plan:
Start layering your buy orders at
👉 $26.50,
👉 $27.00,
👉 $27.50,
👉 $28.00.
You can increase or adjust these levels based on your personal preference or risk appetite.
Each layer allows better cost averaging and stronger positioning if the pullback deepens.
🛑 Stop Loss (SL)
This is the Thief Stop Loss: $25.50.
But, dear Ladies & Gentlemen (Thief OG’s) — I’m not recommending you to stick only to my SL.
Your money, your risk. You make money → you take money. Manage your risk like a pro. ⚖️
🎯 Target (Take Profit)
Our main target sits around $32.50 — this is a strong resistance area, likely to be overbought, and may trap late buyers.
Dear Ladies & Gentlemen (Thief OG’s), again — I’m not recommending you use only my TP.
You decide when to take profits. If you make money, lock it and run like a Thief 🏃♂️💨.
🌍 Related Pairs & Correlation Watch
Keep your radar on the following — they can give early cues about SOFI’s momentum and sector rotation:
💎 ARKK (ARK Innovation ETF) → Fintech & growth exposure. If ARKK rises, SOFI tends to follow.
💎 FINTECH ETFs or Indexes → Check if the overall fintech sentiment is bullish.
💎 SPY & QQQ → Broader tech strength supports SOFI’s upside potential.
📊 Key Focus Points:
Rotation into growth & fintech stocks.
Fed tone on interest rates and macro liquidity.
Breakout volume confirmation above $30 level.
✨ “If you find value in my analysis, a 👍 and 🚀 boost is much appreciated — it helps me share more setups with the community!”
#SOFI #SoFiTechnologies #StockTrading #SwingTrading #DayTrading #TradingSetup #TechnicalAnalysis #StockMarket #FinTech #BullishSetup #TradingStrategy #TheThiefMethod #PriceAction #HullMovingAverage #RiskManagement #TradingIdeas #MarketAnalysis #StockPicks #TradingCommunity #InvestSmart

$SOFI Technical Setup Looks Bullish NASDAQ:SOFI Bull flag pennant. Coiling for the last month.
Setup looks very bullish going into earnings next week.
One to keep on your radar. Could see a big move VERY soon!

Perfect time to get them bollingers tightBands a maker her dance ?
Earnings make her dance?
Whos dancing , us after earnings ?
Lets go sofi!! Here for long since 20-21$ not options trading
Im feeling spicy and i think we see 32.50-35$ upon good earnings next week. Potentially before depending how much volume is FOMOING

Sofi to 37-42$ near earningsNow we rise till earnings and erupt through the stratosphere with volume and fomo once earnings show BULLsignal
Long SOFI and u wont be disapointed

SOFI’s Technical Breakout Signals High-Profit Potential Current Price: $26.54
Direction: LONG
Targets:
- T1 = $28.50
- T2 = $30.00
Stop Levels:
- S1 = $25.50
- S2 = $24.80
**Wisdom of Professional Traders:**
This analysis synthesizes insights from thousands of professional traders and market experts, leveraging collective intelligence to identify high-probability trade setups. The wisdom of crowds principle emphasizes the value of aggregated inputs from experienced market participants, guiding a data-driven, high-confidence approach to investing in SOFI. These traders focus on major valuation shifts, macro trends, and pinpoint technical levels, all of which are now signaling a bullish outlook for SOFI shares.
**Key Insights:**
SOFI’s stock has exhibited strong upward momentum driven by stellar improvements in key financial metrics, including growth in both member counts and product expansion. The company has been a major disruptor in the financial services industry, leveraging technology to deliver innovative solutions such as personal loans, credit products, and stock trading platforms. As of late 2025, management’s sharp focus on product diversification and profitability positions SOFI for higher valuations as market participants anticipate a more sustained positive trajectory.
The ongoing normalization of interest rates has significantly supported SOFI’s lending operations, while its steady growth in deposits continues to reduce funding costs. Further, SOFI’s robust execution of its financial strategy is evident in its balance sheet improvement, increasing operating metrics, and positive shareholder sentiment. Analysts highlight that the company's approach to digitizing banking services positions it for accelerated adoption, particularly among younger consumers and tech-savvy investors.
**Recent Performance:**
SOFI’s stock has demonstrated impressive resilience over the past quarter of 2025, rallying 18% from its previous support zone at approximately $22.50. Market participants have noted consistent buying strength across critical trading sessions, which signals sustained demand among institutional investors. At $26.54, SOFI has broken out of recent consolidation patterns, further confirming an optimistic outlook, with experts eyeing $28.50 as the next important resistance level.
**Expert Analysis:**
Several technical analysts regard SOFI as poised for extended upside. The bullish crossover observed on the Moving Average Convergence Divergence (MACD) indicator confirms building momentum. Similarly, the Relative Strength Index (RSI) remains in safe territory, hovering around the mid-60s range, suggesting that SOFI has room to explore higher levels without the risk of immediate overbought conditions.
Experts commend SOFI’s recent strides toward GAAP profitability as a key catalyst for upward movement, alongside robust loan origination growth, which has defied macroeconomic headwinds. Enhanced customer retention rates also serve as a cornerstone for solidifying future revenue streams. Additionally, quarterly earnings from Q3 2025 exhibited stellar trajectory for both EPS improvements and revenue beats, reinforcing expectations for continued share value appreciation through the remainder of the year.
**News Impact:**
Recent headlines highlight SOFI’s advances in technology partnerships and its introduction of AI-driven banking solutions, enabling broader market penetration. A key development has been SOFI's increasing engagement with government programs to deploy expanded lending services to underserved communities, which has opened new growth opportunities. Furthermore, investor confidence soared when the company reaffirmed its guidance for accelerated earnings growth in fiscal 2025, fueling optimism for record-breaking annual results. This blend of positive news has created strong market tailwinds.
**Trading Recommendation:**
Based on SOFI's favorable fundamentals, strong technical setup, and broad growth catalysts, traders are advised to adopt a bullish position on SOFI. The breakout from previous resistance zones and robust accumulation signals high upside potential. Target levels at $28.50 and $30.00 reflect achievable milestones if momentum persists, while stop levels are strategically placed at $25.50 and $24.80 to protect downside risk. Planning a long position in SOFI now could yield lucrative returns as the stock progresses through its current bullish cycle.
Do you want to save hours every week? Register for the free weekly update in your language!

$SOFI closed at 30First time closing right at 30 today. Earnings tomorrow. around 3% up after-hours. ready to take on the next target Fib level 1.618 at 43.09.

SOFI Breakout to 30$SoFi Technologies is primed for a major rally. The weekly chart is displaying a classic cup and handle formation, which is one of the most reliable bullish patterns in technical analysis. With the handle nearing completion, the stage is set for a breakout—often marking the start of strong upward moves as traders and investors take notice.
What gives this technical setup extra weight is SoFi’s recent earnings performance. The company delivered robust results, surpassing analyst expectations and showcasing significant growth in its key lending and technology divisions. This mix of a textbook bullish pattern and solid fundamentals sets the stock up for a rapid advance, making a $30 target look more achievable in the near term. As momentum builds, both the technical traders and fundamentals-focused investors could fuel the next leg higher for SoFi.

SOFI Easy Short into Earnings Been trading sofi for almost all year now its how ive made my living. with that being said we should see a gap down. most these shares were accumulated around 18-19 bucks retail wise anyways.

SOFI: Buyers in Control? Heading Toward $31?SOFI is showing strength as AVWAP and HVN hold as key support — a clear sign that buyers are in control. 📊
If momentum continues, we could see a push toward the $31 target zone in the coming weeks.
👉 What’s your take — breakout incoming or another retest of support first?
Based on :
- Fundamental analysis
- Avwap and HVN levels
- Quantitative analysis

If this aint a sign to buy SOFIA, see you at 64$ LONG TERM.Im talking 1-2yrs from now, but i see us touching 45$ EOY, nice fakeout. Weak hands gone? Everything is bullish again. BULL FLAG weekly daily 4H. November earnings should be great, plus bullish news with trump (we got 3 more yrs). Wish i bought shares at 16 instead of 21 when i was buying calls.
Time to hold heavy. 400 shares 21.20$ avg
Poised for new highs , i see 37-39$ easily eoy , 45$ is blowing expectations.

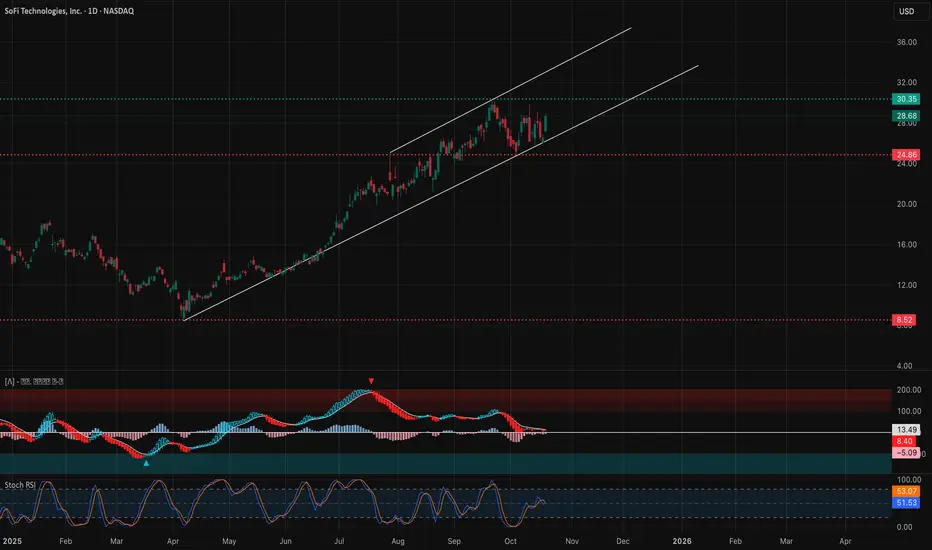
$SOFI Bounce and then measured move to $40.00?NASDAQ:SOFI
*POSTED TWO DAYS AGO BUT REMOVED.*
This setup is very interesting.
Earnings catalyst end of month with potential S&P 500 inclusion towards the end of year.
Max pain at $22.45 support, but would like to see it back above the 20-day MA ($27.21).
A bounce from here could just be the start the measured move to $40.00+.

Bulls vs the BearsWith Sofi displaying bearish divergences on the weekly chart. We take a look at the 4hr chart and anticipate a breakout. A bearish breakout may open the floodgates for the Bears with their next challenge point around the 24.00 range. Bullish breakout for the bulls will be business as usual with their challenge point 26.00, battling a EMA cluster.

Candle ClosesIs the wait for the Bears over? it seems SOFI is being challenged at a key level. If we get a bearish candle close this week lower than last week, combined with a bearish MACD(Chris Moody), combined with the bearish divergences; the bears shall rejoice. Bulls are still in the fight and need price to overcome the 29$ price range.
