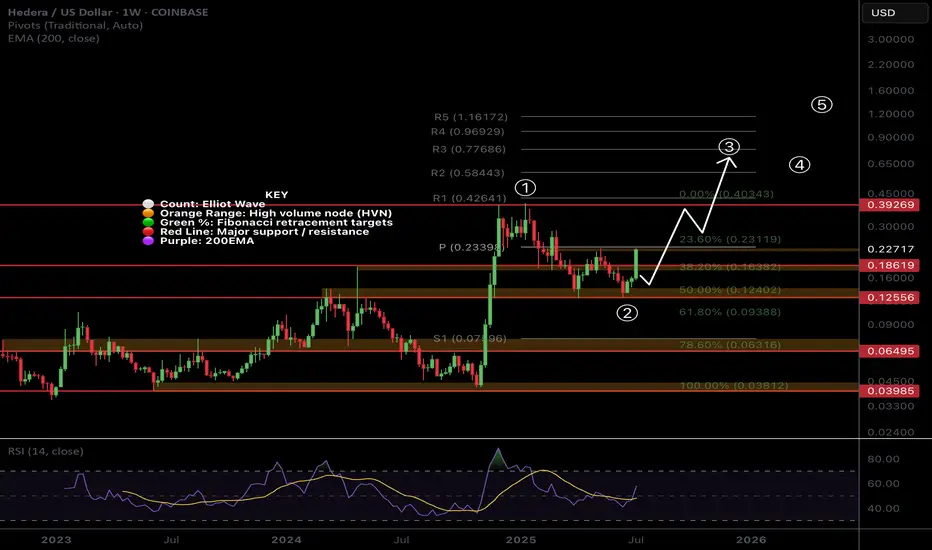
$HBAR Weekly Pivot Time...In classic CRYPTOCAP:HBAR fashion what a powerful move this week! Moves like this leave me skeptical of continuation straight away as you often get a pretty decent pullback afterwards before the next leg up. However how many times have you seen a move like this that completely unwinds weeks later and goes lower?
Wave (3) looks truly underway after wave (2) tested the High Volume Node and 'Golden Pocket' 0.50.618 Fibonacci retracement as support on weekly bullish divergence from the RSI.
The weekly pivot is now resistance and it already proving itself. If price continues the all time high is next resistance and price has a weekly R5 pivot target of $1.2 while the Fibonacci extension targets have a minimum of $5.2..
Analysis is invalidated below $0.12
Safe trading
Trade ideas

$HBAR Shooting Up in Wave 3CRYPTOCAP:HBAR is flying off the High Volume Node and 0.5 Fibonacci retracement with Elliot wave 3 characteristics keeping the count alive.
Price is testing the weekly pivot point which should act as resistance for the time being but a break straight through will demonstrate a very bullish trend. Traders should be cautious about entering here.
RSI confirmed a weekly bullish divergence
Safe Trading
A linear Chart version of the current HBAR bull patternsIt just dawned on me that I had my chart on logarithmic for the previous 2 posts I amde about HBARUSD. As usual, the chart patterns on the log chart tend to have much higher breakout targets than the version of the chart patterns that appear on the linear chart. As soon as I realized this I went back in and adjusted the patterns to their linear chart erosions. The inverse head and shoulders remained mostly the same but the bullflag/desceding channel has now morphed into a falling wedge/bullish pennant. As you can see the breakout target for all 3 patterns is a much lower price than what the price targets were on the logarithmic chart. That’s not to say that the logarithmic targets are invalid, I think what will most likely occur Ike usually is both chart’s targets will be validated, it will likely just take much longer for the logarithmic chart’s targets to be reached as is how things usually pan out. *not financial advice*
HBAR Flagging- Breakout Soon?Clean bullish flag forming after a strong impulse move. Volume’s cooling off during consolidation, textbook setup.
Break above ~$0.205 could trigger the next leg, with a measured target around $0.26–$0.28 if the flag plays out.

Weekly timeframe version of previous HBARUSD postWanted to show my previous hbar idea which was on the daily time frame on the weekly as well so I could fit the pole of the bullflag in the frame here. I will put a link below to my daily time frame version of this post which goes into slight more detail about each pattern and also the Nvidia hbar news. *not financial advice*

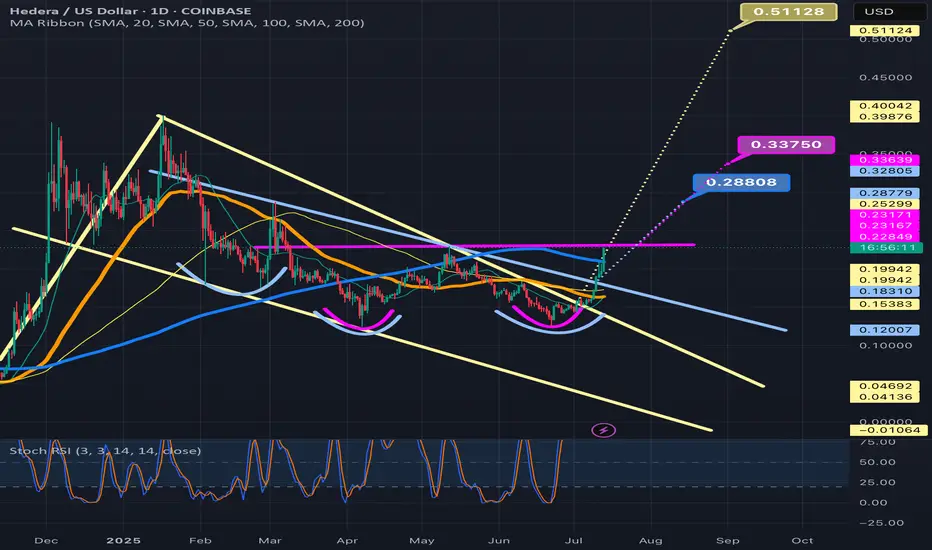
HBARUSD has 3 bullish patterns stacked on top of eachotherThe inverse head and shoulders in the light blue, the light tan is the bull flag, and the pink is the double bottom. Currently price is above the Bullflag and the Inverse head and shoulders pattern. The bullflag also counts as a descending channel pattern as well. We just recently retested the neckline of the inverse head and shoulders as exact wick support which is a good sign. All 3 should provide eachother with the bullish confluence needed for them to be validated, but in addition to this technical bullishness we have some fundamental bullishness occurring just recently too as NVIDIA just announced their new Blackwell chips — claiming them to be the future backbone of AI infrastructure — which are integrating verifiable compute which has its fundamental trust layer built on Hedera. This also provides great bullish confluence and heightens the probability these 3 chart patterns will all be validated and reach their full targets. I will keep updating this post as they do so. *not financial advice*

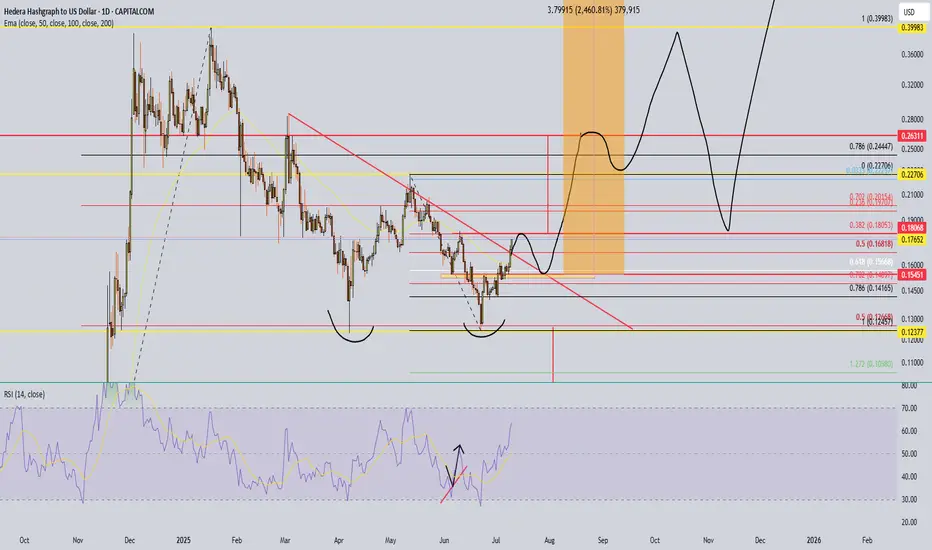
HBAR Descending Triangle, Double bottom, Volume SqueezeHedera Hashgraph is displaying a Descending Triangle, Double bottom, with Volume Squeeze. What more can you ask for?

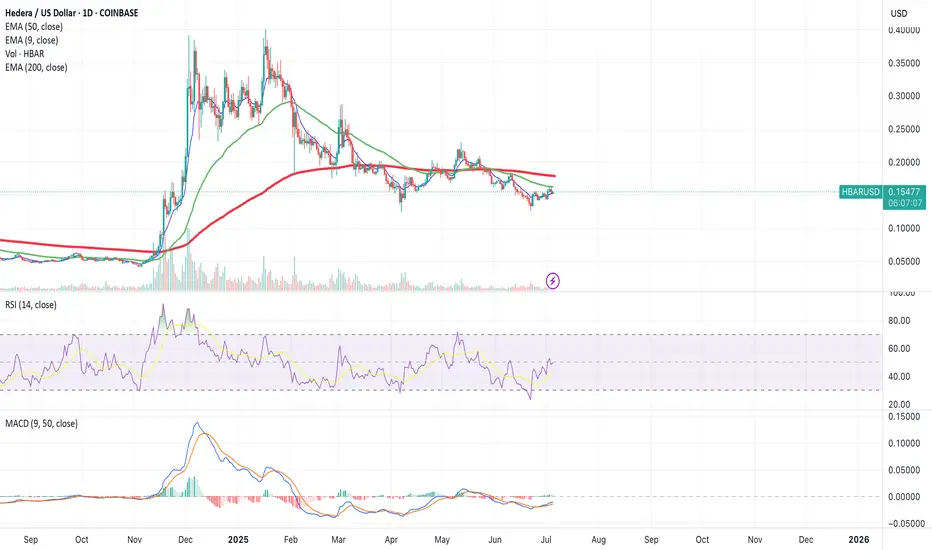
$HBAR Resistance at daily 200EMA!CRYPTOCAP:HBAR analysis continues to play out but should consolidate for a while before moving to the next target at $0.22.
This area should be tough resistance as its the daily 200EMA and major High Volume Node resistance and R1 daily pivot.
The CRYPTOCAP:HBAR signal has now hit take profit #1 from my Trade Signals Substack posted last week.
Safe trading

HBARUSD – Clean Break, No BrakeHBAR broke cleanly from the $0.165 base and extended into $0.177+. The rally has been consistent, with stacked higher lows and shallow dips. Currently approaching local resistance near $0.1790–$0.1800. If it powers through, next target sits around $0.1850. Momentum remains intact unless $0.172 fails.

Hbar going good???On bigger timeframe it touched the 0.5 fib 2 times. On smaller timeframe im hoping to see a Reversal pattern and jump in when the price is 0.1545. Then trade 5 waves up. Correct and go for that bigger trade of a 2000% . Well dont jump in like yolo, just find the pattern first. And use a stoploss man!!!
$HBAR Ready for a move up?CRYPTOCAP:HBAR appears to have completed its wave 2 WXYXZ complex correction
It has broken its descending resistance & daily pivot, retested both as support and is approaching the local swing high which would be a bullish long signal.
Cautious traders may want to take partial take profit at the first resistance High Volume Node and R1 pivot $.18 and a secondary target with good RR is the swing high resistance node at $0.22.
Analysis is invalidated below $.14 swing low.
Safe trading

HBAR ChartHi there,
Any insights on the chart please. I believe that because its still below 50 MA, should wait on an entry.
HBAR to $1.00If price breaks between the 50%-61.8% retracement I'm looking for a long position to $1.00.

HBARUSD: Final rally starting.Hedera is repeating the peak formation of the previous Cycle. Being bearish, almost oversold on its 1D technical outlook (RSI = 35.527, MACD = -0.005, ADX = 29.745) while being supported by its 1W MA50, makes it a buy opportunity again. We turn bullish, targeting the R1 level (TP = 0.39000).
## If you like our free content follow our profile to get more daily ideas. ##
## Comments and likes are greatly appreciated. ##

Monitoring a possible leading diagonal move on Hedera HBARAs you can see in Fig. A, HBAR has often printed some nice, recognisable diagonal patterns (in this case, A was a leading diagonal for a nice 5-count rally).
I believe we have another such diagonal forming now at Fig. B
It's clear that this is a slightly smaller pattern, suggesting a degree lower (I have labelled the first one as intermediate and the recent pattern as minor respectively).
If this is the case, I believe there is every reason to believe that we are about to see HBAR assert itself and embark on a Wave 3 extension - this means that the diagonal rally at B would be wave 1 and we should expect a further rally with wave 3 starting soon and running 1.618 at least of Wave 1 and Wave 5 probably being parity with Wave 1 for length.
Standard elliot wave estimation.
However, we should bear in mind that crypto often involves significant variance on these base estimates so, I'm expecting a really good pop in the near future.
Trade safe!

Hedera Stock Chart Fibonacci Analysis 060125
Trading Idea
1) Find a FIBO slingshot
2) Check FIBO 61.80% level
3) Entry Point > 0.167/61.80%
Chart time frame:B
A) 15 min(1W-3M)
B) 1 hr(3M-6M)
C) 4 hr(6M-1year)
D) 1 day(1-3years)
Stock progress:A
A) Keep rising over 61.80% resistance
B) 61.80% resistance
C) 61.80% support
D) Hit the bottom
E) Hit the top

HBAR (Local) Elliot Wave ii UnderwayHBAR appears to have completed a leading diagonal for wave 1 after finding a bottom at the major support high volume node (HVN).
Wave 2 has retraced the expected 61.8% Fibonacci but alt coins have their own Golden Pocket at the 78.6% retracement which aligns with the S1 pivot and high volume node.
The descending resistance line has been tested as support leaving a doji but does not look strong enough to be the bottom yet.
Wave 3 should be a powerful move up.
This analysis is invalidated below macro wave 4 -$0.12556
Safe trading

HBAR Will Make a Nice Run After May 26thHBAR will be one of the cryptocurrencies that will rip the hardest this cycle.
Currently HBAR is going to sweep a liquidation wick at around .16-.17 (Should be hit before May 26th)
from there on, HBAR should have a 5 week consecutive rally to above $1.8 until the end of June to beginning of July.
Load up on the dip.


HBAR RAB-H Rabbi Hedera gave you the money tomorrow and then the other one and I can do the money to the other one and then I got the money tomorrow morning and I will send it out to me today

ChannelsStochastic RSI is in oversold zone.
RSI is in oversold zone.
CCI near reversal zone
Price has cycled downed to the bottom of an upward parallel channel and the 200 EMA in orange.
VIX indicator recently flashed bottom is in.
Indicators are pointing toward a reversal
If price has a bearish breakout from upward parallel channel we can possibly see .18 to .17 prices. If we get a reversal we can see .20 cents again.

HEDERA Not high hopes. Upside is limited.Hedera / HBARUSD is on a 1week MA50 rebound with the 1week MACD close to a Bullish Cross formation.
This is the very same pattern it followed near the end of the previous Cycle on the June 21st 2021 rebound.
See the identical 1week MACD patterns, even the similar price structure on the 2020 and 2024 Bull Flags that initiated parabolic rallies.
Actually HBAR topped 2 weeks after the 1week MACD formed the Bullish Cross. The Bearish Divergence there was evident.
As a result, since the previous Cycle topped on the 1.236 Fibonacci extension, we expect HBAR to rise to 0.5000 max. Nothing like the parabolic rally it had after the recent U.S. elections.
Follow us, like the idea and leave a comment below!!

HBAR: Keep an eye on this level!Trading Setup
If you’re considering trading HBAR, here’s a quick setup that may help you.
The idea is: Buy when the price breaks above $0.216 and take profits at the levels shown in the chart.
Targets:
1. $0.225
2. $0.244
3. $0.254
4. $0.28
-------------------------------------------
About our trades:
Our success rate is notably high, with 10 out of 11 posted trade setups achieving at least their first target upon a breakout price breach (The most on TW!). Our TradingView page serves as a testament to this claim, and we invite you to verify it!
