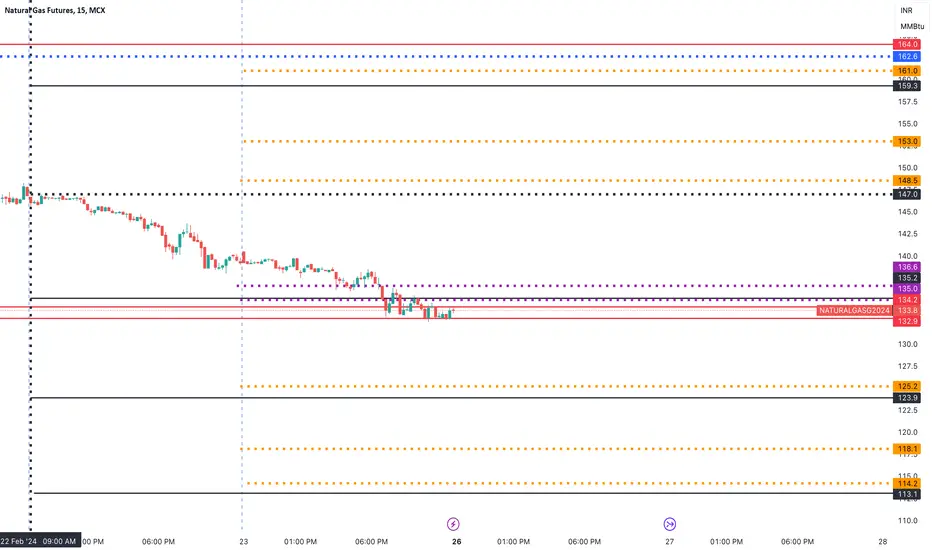
NATURALGAS Future - Intraday Levels - 7th March 2024If Sustain above 161 then 164 then 165 then 166 to 166 then 167 above this bullish then 148 then 153 then 159 to 162 then 164
If Sustain Above 16o then 157 then 152 below this bearish then 151 to 149 then 147 then 145
Consider some buffer points in above levels.
Please do your due diligence before trading or investment.
**Disclaimer -
I am not a SEBI registered analyst or advisor. I does not represent or endorse the accuracy or reliability of any information, conversation, or content. Stock
In-depth trading ideas
NATURAL GAS Cycle bottom. Now one of the best buys of the year.Natural Gas / NG has been trading inside an 18 year Channel Down pattern.
It has been below both the 1M MA50 and MA200 since January 2023, as it entered into the 2nd phase of the Bearish Wave.
Last week it hit the Falling Support Zone as well as the horizontal Support Zone, which is in effect since December 2015.
The 1M RSI touched its own Rising Support.
We are at the bottom of the Sine Wave, which means that this is a Cyclical Low, a pattern holding since 2010.
This is a very bullish long
Potential NQ Futures Buy IdeaHere is my perspective of what Nasdaq futures will do very soon.
After sweeping external liquidity above the previous days high, I can see price mitigating internal liquidity then rallying up with the higher timeframe direction.
I am using standard deviation projections to calculate my take profit level
Natural Gas Price Forecast | DXY Crude Oil Silver GoldNatural Gas Price Forecast | DXY Crude Oil Silver Gold
0:00 Natural Gas stock Bulls NatGas Support & Resistance Guide
05:29 AMEX:UNG Stock Forecast
06:37 USO Oil Stock Forecast
09:18 DXY US dollar Stock Forecast
11:08 Gold XAUUSD Stock Forecast
12:30 Silver XAGUSD
NATGAS Trading Opportunity! SELL!
My dear friends,
NATGAS looks like it will make a good move, and here are the details:
The market is trading on 1.836 pivot level.
Bias - Bearish
Technical Indicators: Supper Trend generates a clear short signal while Pivot Point HL is currently determining the overall Bearish trend of the market.
Goal - 1.653
Recommended Stop Loss - 1.929
About Used Indicators:
Pivot points are a great way to identify areas of support and resistance, but they work best when combined with other kinds of
Natural Gas Price Forecast | DXY Crude Oil XAUUSD XAGUSDNatural Gas Price Forecast | DXY Crude Oil XAUUSD XAGUSD
00:00 Natural Gas stock Bulls NatGas Support & Resistance Guide
04:55 AMEX:UNG Stock Forecast
07:08 USO Oil Stock Forecast
09:20 DXY US dollar Stock Forecast
10:54 Gold XAUUSD Stock Forecast
12:28 Silver XAGUSD
NATGAS Resistance Ahead! Sell!
Hello,Traders!
NATGAS keeps going up
In a bullish correction but
The price will soon hit
A strong horizontal resistance
Level of 2.016$ and after
That retest a bearish reaction
And a move down are
To be expected
Sell!
Like, comment and subscribe to help us grow!
Check out other forecasts below too!
When will there be the long-awaited rebound in gas prices?If you would like to be notified whenever I post a new article, just click "FOLLOW" at the top. Also, if you would like to elaborate on a particular topic or need some advice, please comment below the article and I will be happy to help you.
When will there be the long-awaited rebound in gas prices?
After a sharp drop of 7.5 percent in the previous session, the U.S. Natural Gas Future - Apr 2024 (NGJ4) rose slightly above the $1.65/MMBtu mark. Traders are facing an oversupply situation with hi
Natural Gas Price Forecast | DXY Crude Oil XAUUSD XAGUSD
00:00 Natural Gas stock Bulls NatGas Support & Resistance Guide
06:13 AMEX:UNG Stock Forecast
08:12 USO Oil Stock Forecast
10:01 DXY US dollar Stock Forecast
11:54 Gold XAUUSD Stock Forecast
13:04 Silver XAGUSD
NATGAS Set To Grow! BUY!
My dear friends,
NATGAS looks like it will make a good move, and here are the details:
The market is trading on 1.582 pivot level.
Bias - Bullish
Technical Indicators: Supper Trend generates a clear long signal while Pivot Point HL is currently determining the overall Bullish trend of the market.
Goal - 1.638
About Used Indicators:
Pivot points are a great way to identify areas of support and resistance, but they work best when combined with other kinds of technical analysis
———————————
NATURALGAS Future - Intraday Levels - 26th Feb 2024If Sustain above 136 then 147 to 148 then 153 then 159 to 162 then 164
If Sustain Below 133 then 125 to 123 then 118 then 114 to 113
Consider some buffer points in above levels.
Please do your due diligence before trading or investment.
**Disclaimer -
I am not a SEBI registered analyst or advisor. I does not represent or endorse the accuracy or reliability of any information, conversation, or content. Stock trading is inherently risky and the users agree to assume complete and full responsi
/NG: Secondary Bearish Entry Targeting Gap-Fill and a BAMMNatural Gas has gapped up to the 21 SMA during tonight's futures open and appears to be setting up for one last decline to fill the gap, but I think it will likely overshoot the gap and come down to the HOP level of the Bat down at around $1.50 to compete the BAMM, from there we may see natural gas attempt a bottom.
Natural Gas, OIL Silver DXY Gold Price Forecast:Natural Gas, OIL Silver DXY Gold Price Forecast:
Support & Resistance Guide
00:00 Natural Gas stock Bulls NatGas Support & Resistance Guide
06:13 AMEX:UNG Stock Forecast
08:12 USO Oil Stock Forecast
10:01 DXY US dollar Stock Forecast
11:54 Gold XAUUSD Stock Forecast
13:04 Silver XAGUSD
Natural Gas Futures Bearish Square Up to $1.6 is LikelyNatural Gas has recently gone up a lot, the problem is that much of this was done in pre- and post-market sessions, with square-up candles printed along the way. It is very likely that as Natural Gas breaks back below $1.70 that we see the price-action square up to the $1.6 area.
Natural Gas Price Forecast | DXY Oil XAUUSD XAGUSDNatural Gas Price Forecast | DXY Oil XAUUSD XAGUSD
00:00 Natural Gas stock Bulls NatGas Support & Resistance Guide
04:12 AMEX:UNG Stock Forecast
08:53 USO Oil Stock Forecast
10:55 DXY US dollar Stock Forecast
12:31 Gold XAUUSD Stock Forecast
13:42 Silver XAGUSD
Natural gas FibonacciNatural gas has a nice correction after the traders cash out their position after a big rally in price.
In this analysis i use Fibonacci retracements to see in the short term were the price can go.
The price hit 0.618 zone Fibonacci retracements in the correction down move so i expect to go back on the 0.618 zone Fibonacci expansion.
My TP is 1.720
Don't forget guys, this is just my opinion.
Good luck!
Natural Gas LONG TERM TRADE analysisHello Traders
In This Chart NATGAS HOURLY Forex Forecast By FOREX PLANET
today NATGAS analysis 👆
🟢This Chart includes_ (NATGAS market update)
🟢What is The Next Opportunity on NATGAS Market
🟢how to Enter to the Valid Entry With Assurance Profit
This CHART is For Trader's that Want to Improve Their Technical Analysis Skills and Their Trading By Understanding How To Analyze The Market Using Multiple Timeframes and Understanding The Bigger Picture on the Charts
NATURALGAS Future - Intraday Levels - 22nd Feb 2024**Levels marked at 6.55 PM IST
If Sustain above 144 then 147 then 150 then
If Sustain Below 144 then 138 to 133 then 130 then 126
Consider some buffer points in above levels.
Please do your due diligence before trading or investment.
**Disclaimer -
I am not a SEBI registered analyst or advisor. I does not represent or endorse the accuracy or reliability of any information, conversation, or content. Stock trading is inherently risky and the users agree to assume complete and full respons
Natural Gas (NG) Long Trade AnalysisNatural Gas (NG) Long Trade Analysis
Entry:
In this analysis, we target a long trade for Natural Gas (NG) from the level of 1.727.
Technical Analysis:
Strong Support at 1.727:
The level of 1.727 appears to be a robust support on the chart.
We observe repeated bounces from this level in the past.
Positive Technical Formations:
A positive technical formation is evident on a lower timeframe, such as a crossover of the Relative Strength Index (RSI) in the buying zone.
Overall Trend is Positive:
GOOG Is Starting To Bottom OutThe TrendCloud System is specifically designed for Trend Following and Trend Reversal Trades.
It will show you when the Trend has become extended and heading for a major level of support. In this case, its the 100 SMA.
Start looking for the option chain on around this area or just wait for the TrendCloud Signal to go long.
If you want to trade trend reversal setups then click the link in my profile and start using the same trade plan that is already making money in 2024.
We are over 10%