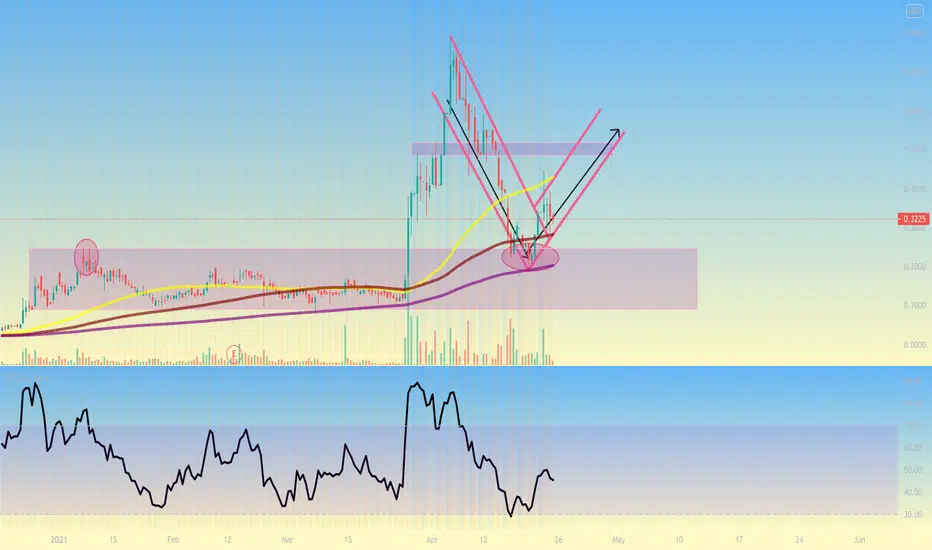
INVU - Scalp OpportunityINVU and its SAFETek subsidiary have been mining Bitcoin since the last bull run. I feel there could be a divergence in value here and more clearly so if we put some value to the VWAP that was anchored to the last year. I am targeting .022 to start.
Not financial advice, DYOR.
0.0007USD
2.83 MUSD
67.92 MUSD
988.37 M
About Investview Inc.
Sector
Industry
CEO
Victor M. Oviedo
Website
Headquarters
Haverford
Employees (FY)
24
Founded
1946
ISIN
US46183W1018
FIGI
BBG000C4F0D6
InvestView, Inc. is a financial technology (FinTech) services company, which engages in the provision of financial products and services to individuals, investors, and financial institutions. It offers financial education, current market research, and technology. Its services include basic financial educational, expense and debt reduction tools, research, newsletter alerts, and live education rooms that include instruction on the subjects of equities, options, Forex, ETFs, binary options, crowd funding, and the emerging Crypto currency market. The company was founded by Ryan Smith, Chad Miller, Annette Raynor, and Mario Romano on January 30, 1946 and is headquartered in Haverford, PA.

INVU - Bitcoin Miner Penny Stock I think we can see another 17% on INVU if BTC stays bullish. We should be able to retest the upper part of the channel. We have momentum to the upside on the daily. Not financial advice.

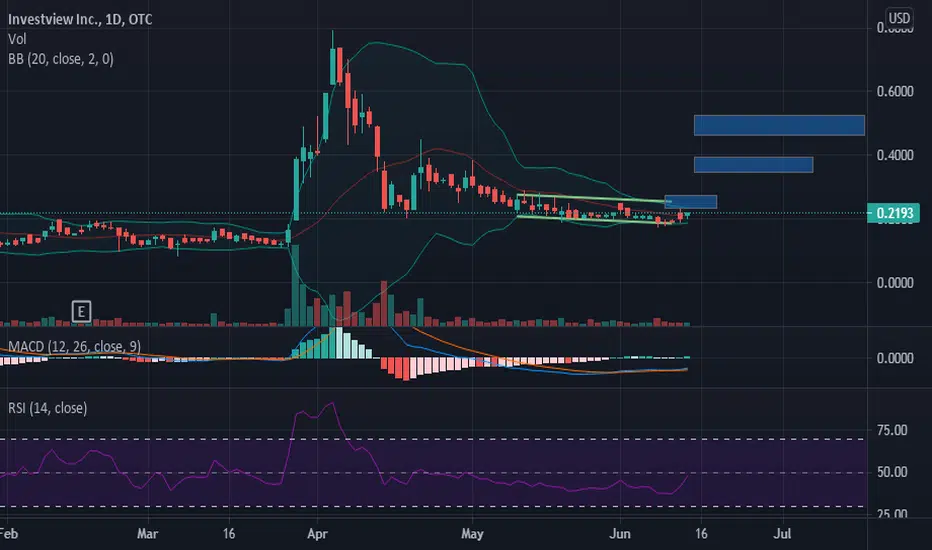
INVU possible breakout We have a nice little breakout but we may need to back test, perhaps a small position to DCA from here? This will be a tough play as it tends to follow BTC sentiment. I would buy a bit at $.022 if it comes back and holds well. NFA,DYOR.

INVU cant go much lower can it?This company mines BTC and I am thinking if there is a run up on crypto this company could benefit as a result. Investview has had a very hard year but we could be near a bottom at this point. I sold at 10 cents and now I am looking at this close as a buy back level. Not financial advice.

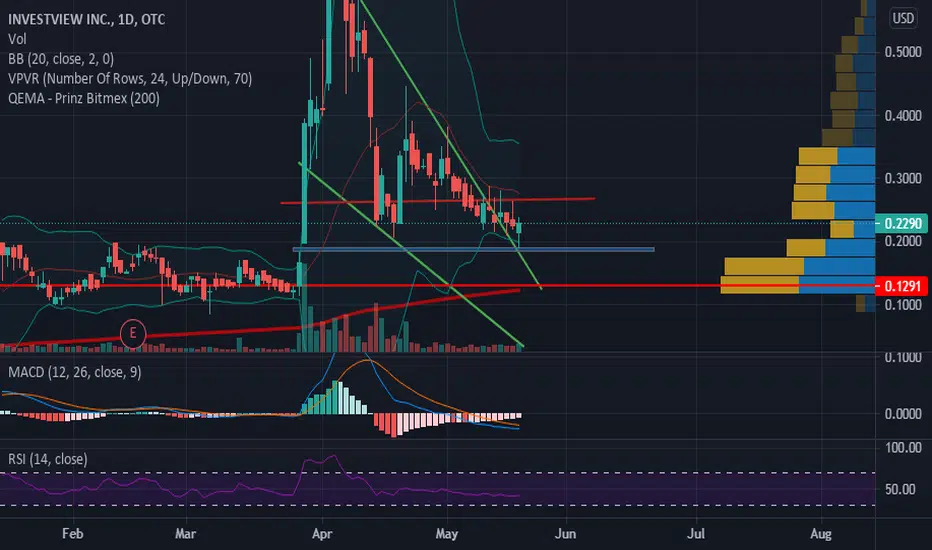
The Penny Stonk Bitcoin Miner You Never Heard AboutThis one has lots of controversy with the former CEO Joe Camarata but not as much with the company itself, fundamentally this one could rip up hard, it's more profitable every quarter and they hodl NDAU coin. Because of the debt they sell a bit of the BTC that they mine, but they invest in mining eq

Load up people.5th test of bottom complete! This is basically an arbitrage trade. Whenever Bitcoin takes off the attention of these small players are forgotten for a time.

INVU waiting for volume, huge gains waiting patiently. This penny stonk, which is also a bitcoin miner, likely accumulated extra BTC in mining the last few months considering the lower price and hash rates. Getting back up to $1 is not impossible. I am hoping to see 30 cents here soon, but patience will be key with this one. I would like to see stronger

INVU - A trade you will rememberThis trade is semi reliant on BTC. Please note how we bottomed out but BTC kept falling, then BTC ran up and this has yet to move. This is the most under priced BTC mining stock that I can find. It sure appears to be under accumulation ;)
INVU Ready for a ride up again???Technically speaking we did not fully fill the gap below, but we came close. I think BTC will determine this play but, all things considered BTC is holding up ok. I have an order still at 37k in case we retest. I have bought more INVU like a desperate junky and here is why:
1) BTC just completed a
has potential to run, be careful with penny stocks though :) bouncing off its previous resistance area before the big breakout to .8, previous resistance is acting as support for now, we can target .50 area and sell if it breaks below the .25 support.🧐 remember to like and follow <3
See all ideas
Trade directly on the supercharts through our supported, fully-verified and user-reviewed brokers.


Frequently Asked Questions
The current price of INVU is 0.0162 USD — it has increased by 0.84% in the past 24 hours.
Depending on the exchange, the stock ticker may vary. For instance, on OTC exchange Investview Inc. stocks are traded under the ticker INVU.
INVU stock is 3.35% volatile and has beta coefficient of 1.37. Check out the list of the most volatile stocks — is Investview Inc. there?
Yes, you can track Investview Inc. financials in yearly and quarterly reports right on TradingView.
INVU stock has fallen by 6.16% compared to the previous week, the month change is a 18.83% fall, over the last year Investview Inc. has showed a 44.02% decrease.
INVU net income for the last quarter is −181.69 K USD, while the quarter before that showed 2.01 M USD of net income which accounts for −109.05% change. Track more Investview Inc. financial stats to get the full picture.
Today Investview Inc. has the market capitalization of 29.96 M, it has decreased by 8.71% over the last week.
No, INVU doesn't pay any dividends to its shareholders. But don't worry, we've prepared a list of high-dividend stocks for you.
Like other stocks, INVU shares are traded on stock exchanges, e.g. Nasdaq, Nyse, Euronext, and the easiest way to buy them is through an online stock broker. To do this, you need to open an account and follow a broker's procedures, then start trading. You can trade Investview Inc. stock right from TradingView charts — choose your broker and connect to your account.
As of Apr 19, 2024, the company has 24.00 employees. See our rating of the largest employees — is Investview Inc. on this list?
Investing in stocks requires a comprehensive research: you should carefully study all the available data, e.g. company's financials, related news, and its technical analysis. So Investview Inc. technincal analysis shows the sell today, and its 1 week rating is strong sell. Since market conditions are prone to changes, it's worth looking a bit further into the future — according to the 1 month rating Investview Inc. stock shows the sell signal. See more of Investview Inc. technicals for a more comprehensive analysis.
If you're still not sure, try looking for inspiration in our curated watchlists.
If you're still not sure, try looking for inspiration in our curated watchlists.
EBITDA measures a company's operating performance, its growth signifies an improvement in the efficiency of a company. Investview Inc. EBITDA is 11.34 M USD, and current EBITDA margin is 16.69%. See more stats in Investview Inc. financial statements.