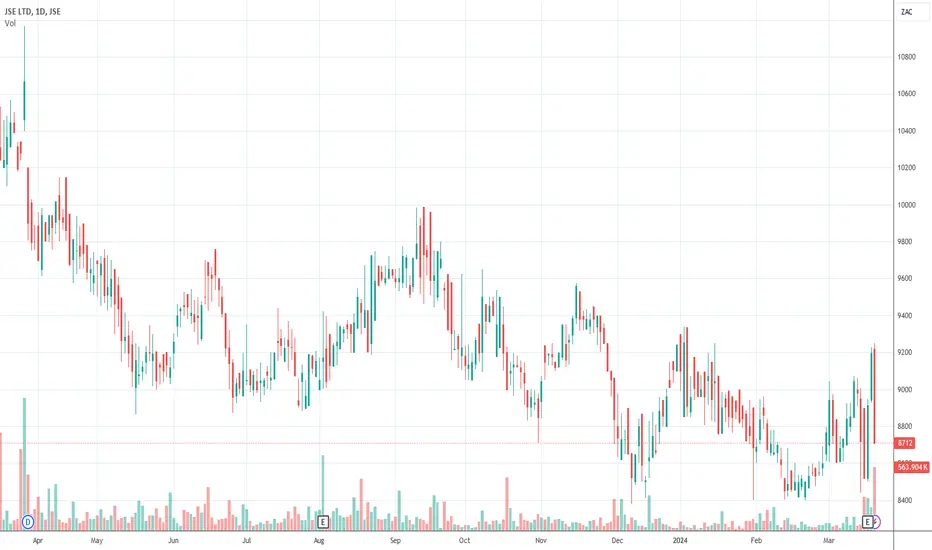
Expecting a recovery in JSE.Expecting a recovery in the JSE because since the beginning of last years financial year prices have been steadily declining but also exporting mining companies in the JSE have been exporting minerals at a premium which could be good for earnings numbers. The JSE is consists of a majority of mining
0.56USD
45.37 MUSD
154.61 MUSD
79.28 M
About Jse Ltd.
Sector
Industry
CEO
Leila Fourie
Website
Headquarters
Sandton
Founded
1887
ISIN
ZAE000079711
FIGI
BBG000R8XSZ6
JSE Ltd. operates as a self-regulatory, multi-asset class stock exchange. The firm offers liquidity of tradable products, post-trade, technology, and information services. It also provides primary market, secondary market, and post-trade services. The company was founded by Benjamin Wollan on November 8, 1887, and is headquartered in Sandton, South Africa.

Our opinion on the current state of JSEThe Johannesburg Stock Exchange (JSE), listed on its own platform, serves as a securities exchange facilitating the trading of shares, bonds, and derivatives. With approximately 320 listed and quoted shares, it stands as the largest stock exchange in Africa by market capitalization and ranks 17th gl
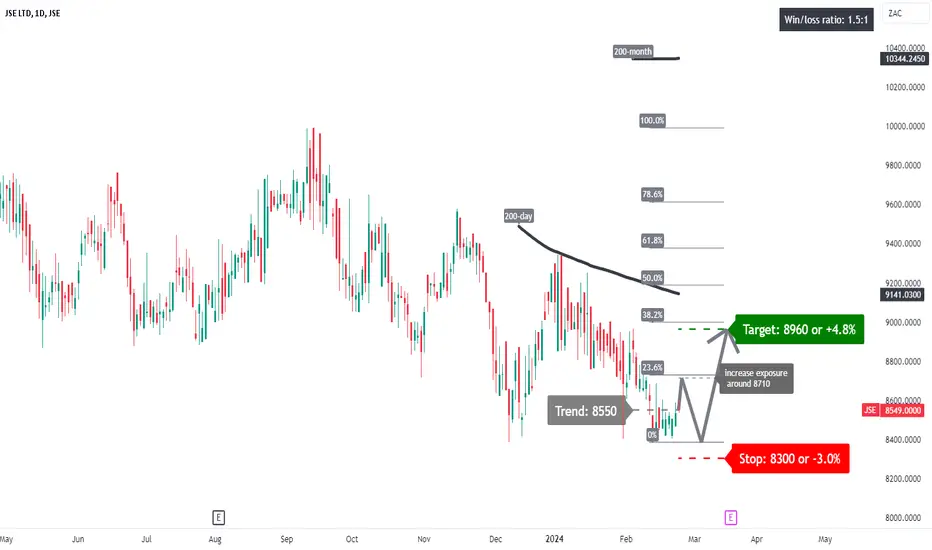
JSE: recovery price action?A price action above 8550 supports a bullish trend direction. Crossing below this level will be the first sign of some weakness.
Increase long exposure for a break above 8710.
The target price is set at 8960 (its 38.2% Fibonacci retracement level).
Might see an overshoot to its 200-day simple moving
JSE 40 Index | Daily | Speculation Looking at the JSE 40 all-share Index on the daily chart we can take note that the index has been trading downwards since peaking sometime during Feb 23, now looking to the left again we can take note that after the release of the 1st quarter Dividend & Earnings release the JSE drop on both accounts

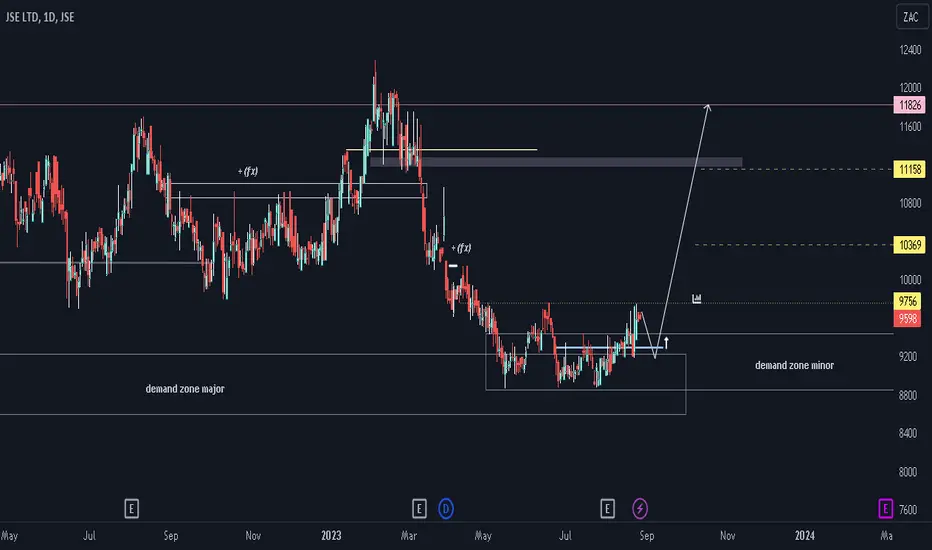
JSE Rocket Launch | Bullish OptimismJSE appears bullish on the daily chart; the price is anticipated to fall for a pullback or it can also rise above the 9756.
A lot of sentiment is in this chart, which is best followed by fundamentals as there are developments around it. It has the potential to increase to extreme levels, so monitor
JSE - Higher lows- Not a very exciting stock as it trades in a massive range
- The chart is printing higher lows since June 22' and could possibly push higher here but its likely to be a grind.
- I would look for pullbacks to enter a position , somewhere closer to R105

JSE showing signs of strengthJSE has been in a descending triangle pattern since march 2022 which broke to to upside earlier this month, today we are seeing the retest of the R108.00 breakout level
and if this holds we can see bulls start moving higher to eventually test R116 resistance

JSE Going upGoing up, take a good look on the BCI on monday for a close above 11257.00 to take a run up to 11803.00 on the JSE but a loss will result in a dip move to 11257.00... wait for the BCI results n trade

JSE HOING UPIf the BCI comes with a great value the JSE will see a rise to 11803.00, but if the results comes out worst it will see a loss down to 11109.00, so wait for a bullish confirmation n buy to 11803.00 , where else on the other side wait for for a rejection on that11257.00 price level n then a confirmat

JSE supportJSE been trading sideways for a while now. Currently trading on support at the R100 level. If it can hold this area of support first target will be R110 and after that R125 area.
Trade ideas are my own and not financial advice.

See all ideas
Trade directly on the supercharts through our supported, fully-verified and user-reviewed brokers.


Frequently Asked Questions
The current price of JSEJF is 4.55 USD — it has decreased by 2.36% in the past 24 hours.
Depending on the exchange, the stock ticker may vary. For instance, on OTC exchange Jse Ltd. stocks are traded under the ticker JSEJF.
Jse Ltd. is going to release the next earnings report on Aug 7, 2024. Keep track of upcoming events with our Earnings Calendar.
JSEJF stock is 2.42% volatile and has beta coefficient of 0.37. Check out the list of the most volatile stocks — is Jse Ltd. there?
One year price forecast for Jse Ltd. has a max estimate of 5.72 USD and a min estimate of 4.48 USD.
Yes, you can track Jse Ltd. financials in yearly and quarterly reports right on TradingView.
JSEJF net income for the last quarter is 18.47 M USD, while the quarter before that showed 26.07 M USD of net income which accounts for −29.17% change. Track more Jse Ltd. financial stats to get the full picture.
Today Jse Ltd. has the market capitalization of 355.15 M, it has decreased by 1.41% over the last week.
Yes, JSEJF dividends are paid annually. The last dividend per share was 0.41 USD. As of today, Dividend Yield (TTM)% is 9.13%. Tracking Jse Ltd. dividends might help you take more informed decisions.
Jse Ltd. dividend yield was 8.48% in 2023, and payout ratio reached 76.92%. The year before the numbers were 7.09% and 84.40% correspondingly. See high-dividend stocks and find more opportunities for your portfolio.
Like other stocks, JSEJF shares are traded on stock exchanges, e.g. Nasdaq, Nyse, Euronext, and the easiest way to buy them is through an online stock broker. To do this, you need to open an account and follow a broker's procedures, then start trading. You can trade Jse Ltd. stock right from TradingView charts — choose your broker and connect to your account.
Investing in stocks requires a comprehensive research: you should carefully study all the available data, e.g. company's financials, related news, and its technical analysis. So Jse Ltd. technincal analysis shows the sell today, and its 1 week rating is sell. Since market conditions are prone to changes, it's worth looking a bit further into the future — according to the 1 month rating Jse Ltd. stock shows the sell signal. See more of Jse Ltd. technicals for a more comprehensive analysis.
If you're still not sure, try looking for inspiration in our curated watchlists.
If you're still not sure, try looking for inspiration in our curated watchlists.
We've gathered analysts' opinions on Jse Ltd. future price: according to them, JSEJF price has a max estimate of 5.72 USD and a min estimate of 4.48 USD. Read a more detailed Jse Ltd. forecast: see what analysts think of Jse Ltd. and suggest that you do with its stocks.
EBITDA measures a company's operating performance, its growth signifies an improvement in the efficiency of a company. Jse Ltd. EBITDA is 55.91 M USD, and current EBITDA margin is 36.22%. See more stats in Jse Ltd. financial statements.