KAIA/USDT: Bullish Reversal — Multi-Month Accumulation Base Kaia ( CRYPTOCAP:KAIA ) is forming a massive rounding accumulation bottom following prolonged compression around the **$0.030 – $0.035** structural demand zone. With 24-hour spot volume surging and momentum indicators confirming higher-timeframe bullish divergence, price action is coiling tightly fo
Will $KAIA Potential 1100% in Macro term?CRYPTOCAP:KAIA Pumped 214% In Just 2 Months After A -95% Crash. The Potential Upside From The Accumulation Zone Is 1,100%
#KAIA Is Currently Testing A Major HTF Bullish Flip Level After A ~214% Expansion In 2 Months, Following A ~95% Drawdown From Its December 2024 ATH. Price Is Now Extended Into
#KAIA FALLING WEDGE BREAKOUT – PAY CLOSE ATTENTION!CRYPTOCAP:KAIA (KAIA/USDT) has officially confirmed a clean breakout from its multi month Falling Wedge pattern on the 1D chart! Price is holding firmly above the converted resistance trendline, setting the stage for a massive bullish continuation wave in the coming days.
A successful retest and h
KAIAUSDT Forming Bullish MomentumKAIAUSDT is forming a clear bullish momentum pattern, a classic bullish reversal signal that often indicates an upcoming breakout. The price has been consolidating within a narrowing range, suggesting that selling pressure is weakening while buyers are beginning to regain control. With consistent vo
KAIA/USDT (1h) Testing an Inverse Head and Shoulders BreakoutKAIA/USDT is forming a clear inverse head and shoulders pattern on the 1H chart, with the left shoulder around $0.0290, a deeper head near $0.0265–$0.0268, and the right shoulder developing again around $0.0290.
Price has now recovered back toward the neckline around $0.0307–$0.0310 and is testing
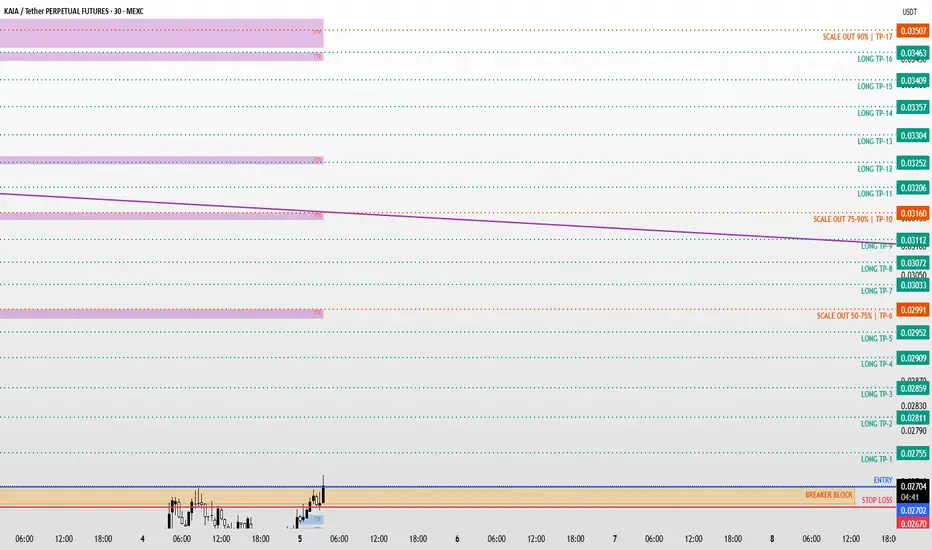
KAIA / KAIAUSDT Long Setup | Breaker Block ReclaimMARKET ANALYSIS
KAIA is currently reacting from a key technical area highlighted on the chart.
As long as the protected support zone remains intact, the bullish market structure remains valid and higher liquidity targets may continue to attract price action.
A breakdown below the invalidation
KAIAUSDT Forming Falling WedgeKAIAUSDT is forming a clear falling wedge pattern, a classic bullish reversal signal that often indicates an upcoming breakout could be approaching soon. The price has been consolidating within a narrowing range, suggesting that selling pressure is gradually weakening while buyers are beginning to r
KAIA/USDT Long CRYPTOCAP:KAIA looks technically primed for a potential move based on the current chart structure. This is just a trading idea, not a signal to jump in blindly — patience is key. Ideally, wait for a clean pullback or a confirmed retest before considering any entries.
As always, manage your risk an
See all ideas
Summarizing what the indicators are suggesting.
Oscillators
Neutral
Oscillators
Neutral
Summary
Neutral
Summary
Neutral
Summary
Neutral
Moving Averages
Neutral
Moving Averages
Neutral
Displays a symbol's price movements over previous years to identify recurring trends.