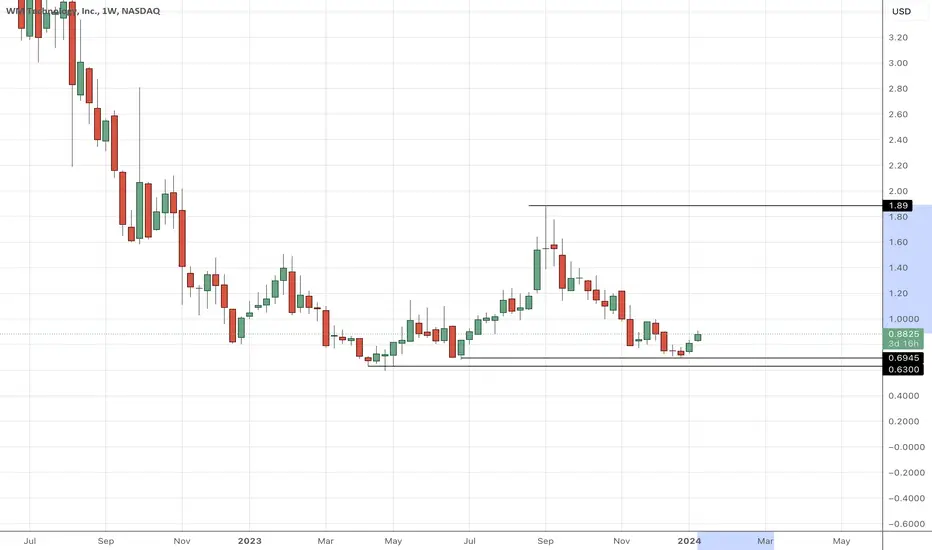
MAPS has a long potentialPure technical analysis point of view, it signaled an Alpha candle from a good chart pattern. Has upside potential.
−1.21USD
−115.99 MUSD
215.53 MUSD
72.84 M
About WM Technology, Inc.
Sector
Industry
CEO
Doug Francis
Website
Headquarters
Irvine
Employees (FY)
583
Founded
2008
ISIN
US92971A1097
FIGI
BBG00PT7WC50
WM Technology, Inc. operates as an online cannabis marketplace. Its products include Weedmaps and Weedmaps for Business. It provides cannabis consumers with information regarding cannabis retailers and brands. The company was founded by Douglas Francis and Justin Hartfield in 2008 and is headquartered in Irvine, CA.

MAPS - Cannabis related Company - Hot SectorWM Technology Inc is a technology and software infrastructure provider to the cannabis industry. It comprises B2C platform Weedmaps, and B2B software WM Business.
This is not a financial advice!
Weed related company - Sector is hot right now.
Rel. Vol on 03/23/2024 at 3.59
We need to stay in a b

MAPS a technology and marijuana penny stock LONGMAPS on 240 minute chart is now in a significant breakout with spiking volume and dramatically
increased relative strength. The breakout was caused by the news that the Biden administration
and specifically VP Harris will now push to legalize marijuana and take it off the DEA's
controlled substa

WeedMaps is undervalued WeedMaps technology has the potential to become the Uber equivalent for the cannabis industry, primarily because of the substantial customer base already associated with Weedmaps. This stock seems poised for growth, especially considering the global acceptance and legalization of cannabis, as well a
WM - Maps To Greener TendiesPrice action has spent months forming a solid bottom and looks to be making the first moves of a breakout.
The Chikou span is up crossing price action, which generally precedes a breakout.
Senkou span is acting as support, aligned with our first support zone.
I would expect the price action to

WM Technology Inc. - Weed Maps $MAPS Chart AnalysisTAKE A HIT OR LET IT SIT?
On the weekly, $MAPS appears to be smoking on the Bobby Brown and following suite via cannabis sector from Feb. '21, but can this ticker start puffing on big clouds to get some investors high on profits? - Soon, soon...
As it sits right now, we are completing the 4th wa

In for a bottomThis stock is rekt hard. But it's one of the only mj companies that actually make a profit. And also the business is like selling shovels in a goldrush. If i didn't had a position already would totally buy this here.

Weedmaps Ponzied - NOMO FOMO - Ignore the Hype - Find #thegem#cannabisreform legislation c/w
#cannabisboom2021 in works. Find the small caps with revenue growth & profits TODAY. Matters most in rising rate environment. Stock pickers win. This ain't it. Run away!
*valuation matters

Daily Cup and Handle forming Cup and Handle in the works. IMO it must pullback a little more to $16.25-$17.00 zone before it moves up.

See all ideas
Trade directly on the supercharts through our supported, fully-verified and user-reviewed brokers.


Curated watchlists where MAPS is featured.


Frequently Asked Questions
The current price of MAPS is 1.18 USD — it has decreased by 1.67% in the past 24 hours.
Depending on the exchange, the stock ticker may vary. For instance, on NASDAQ exchange WM Technology, Inc. stocks are traded under the ticker MAPS.
WM Technology, Inc. is going to release the next earnings report on May 1, 2024. Keep track of upcoming events with our Earnings Calendar.
MAPS earnings for the last quarter are −0.02 USD whereas the estimation was −0.02 USD which accounts for 11.11% surprise. Estimated earnings for the next quarter are −0.02 USD. See more details about WM Technology, Inc. earnings.
WM Technology, Inc. revenue for the last quarter amounts to 47.73 M USD despite the estimated figure of 47.25 M USD. In the next quarter revenue is expected to reach 47.05 M USD.
Yes, you can track WM Technology, Inc. financials in yearly and quarterly reports right on TradingView.
Like other stocks, MAPS shares are traded on stock exchanges, e.g. Nasdaq, Nyse, Euronext, and the easiest way to buy them is through an online stock broker. To do this, you need to open an account and follow a broker's procedures, then start trading. You can trade WM Technology, Inc. stock right from TradingView charts — choose your broker and connect to your account.
As of Apr 16, 2024, the company has 583.00 employees. See our rating of the largest employees — is WM Technology, Inc. on this list?
EBITDA measures a company's operating performance, its growth signifies an improvement in the efficiency of a company. WM Technology, Inc. EBITDA is −18.15 M USD, and current EBITDA margin is −26.69%. See more stats in WM Technology, Inc. financial statements.