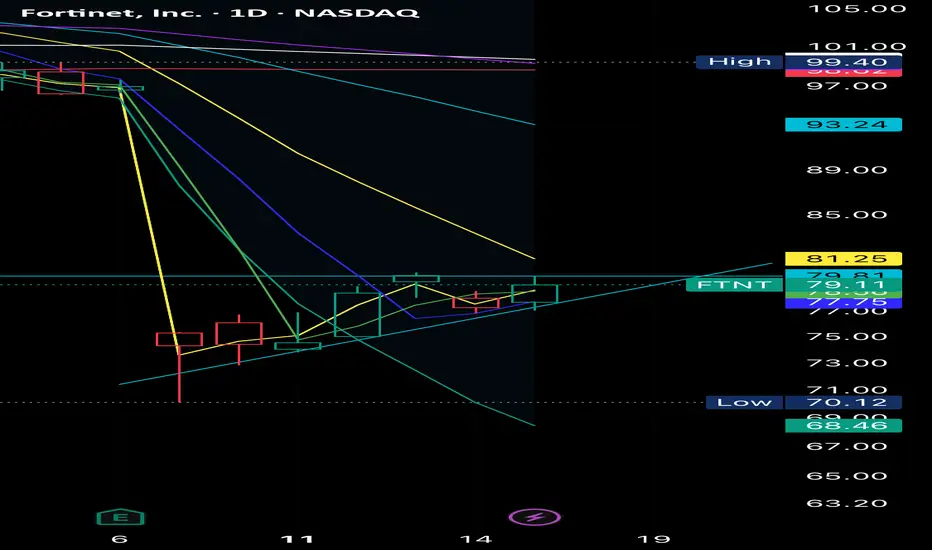
$FTNT ready to break?I like the setup and think it's ready to break the resistance.
There is also a gap down to be filled. Maybe this week we can have that break. I'm in and long.
Next report date
—
Report period
—
EPS estimate
—
Revenue estimate
—
2.09 EUR
1.69 B EUR
5.75 B EUR
618.07 M
About Fortinet, Inc.
Sector
Industry
CEO
Ken Xie
Website
Headquarters
Sunnyvale
Founded
2000
ISIN
US34959E1091
FIGI
BBG01TNWJKH6
Fortinet, Inc. provides cybersecurity solutions to a variety of businesses, such as enterprises, communication service providers, government organizations, and small to medium-sized businesses. Its product portfolio includes network security, secure access service edge, enterprise networking, security operations, application security, and operational technology. The company was founded by Ken Xie and Michael Xie in October 2000 and is headquartered in Sunnyvale, CA.
Related stocks

FTNT sell off is it over?Fortinet experienced a sell-off despite a double earnings beat. The company's fundamentals remain robust, characterized by solid financials and positive free cash flow (FCF). Fundamentally, nothing has changed.
From a technical analysis standpoint, the price reacted to the first algorithmic target l

FTNT eyes on $70-72: Fib supports hope to hold earnings DUMPFTNT earnings report has apparently disappointed.
The crash finally stopped at support zone $70.69-72.09
Looking for accumulation here and climb back up soon.

FTNT: At Long-Term Support. 🔹 Fortinet (FTNT) Market Update 🔹
The chart shows FTNT currently testing a critical support zone (~$79–$80). If this level breaks, we may see deeper downside risk. However, strong earnings fundamentals and volume structure suggest the possibility of accumulation at current levels.
🔹 Key Levels to

The hidden information within a stock chart FTNTFTNT had an excellent report. The CEO guidance stated growth for this year. Yet, retail analysts suddenly reversed their upgrades to a minor downgrade. The stock collapsed 26% which is absurd. What is behind this sudden collapse? Is FTNT going to go down more?
No FTNT gapped down on a fear of an ev

FTNT Bullish set upPotential bounce shown by the ascending triangle pattern. Strong earnings and company growth.
FTNT Long-Term Support & SetupWith Fortinet (FTNT) recently reporting strong Q2 earnings and beating expectations on both top and bottom lines, the stock is seeing a sharp sell-off. Driven by macro uncertainty, rising competition, and weaker Q3 guidance, this move was anticipated for months as FTNT has been trading at the top of

Mean Reversion Trade: FTNT1. RSI in oversold region
2. Price likely to rebound back the the mean
Trade Rules:
Entry Trigger - RSI has cross below oversold region, enter limit buy at close price
Exit Trigger - Close at market when close price cross above exit trigger (Red step line)

FTNT - Precision Swing Trade Setup📈 Symbol: FTNT (Fortinet)
⌛ Timeframe: Daily Chart
⚡ Strategy: High-Conviction Swing Trade (5-10 days)
🎯 Pinpoint Trade Execution
Entry: $103.00 (Key psychological level + SMA 50 confluence)
Stop-Loss: $95.80 (7% risk, below July swing low)
Take-Profit: $118.16 (14.7% upside, pre-earnings resista

$FTNT In a Wedging PatternI bought a ½ size position on June 2nd after it had tremendous volume and institutions protected it from slipping below the 50 DMA the day before. It has been nothing but sideways since and I am slightly underwater. My stop is a decisive close under the 50 DMA. I did not feel the Wed June 18th quali

See all ideas
Summarizing what the indicators are suggesting.
Neutral
SellBuy
Strong sellStrong buy
Strong sellSellNeutralBuyStrong buy
Neutral
SellBuy
Strong sellStrong buy
Strong sellSellNeutralBuyStrong buy
Neutral
SellBuy
Strong sellStrong buy
Strong sellSellNeutralBuyStrong buy
An aggregate view of professional's ratings.
Neutral
SellBuy
Strong sellStrong buy
Strong sellSellNeutralBuyStrong buy
Neutral
SellBuy
Strong sellStrong buy
Strong sellSellNeutralBuyStrong buy
Neutral
SellBuy
Strong sellStrong buy
Strong sellSellNeutralBuyStrong buy
FTNT5139601
Fortinet, Inc. 1.0% 15-MAR-2026Yield to maturity
4.81%
Maturity date
Mar 15, 2026
FTNT5139602
Fortinet, Inc. 2.2% 15-MAR-2031Yield to maturity
4.46%
Maturity date
Mar 15, 2031
See all 1FTNT bonds
Curated watchlists where 1FTNT is featured.

Software stocks: US companies at our finger tips
49 No. of Symbols
See all sparks
Frequently Asked Questions
The current price of 1FTNT is 74.04 EUR — it has increased by 2.10% in the past 24 hours. Watch Fortinet, Inc. stock price performance more closely on the chart.
Depending on the exchange, the stock ticker may vary. For instance, on MIL exchange Fortinet, Inc. stocks are traded under the ticker 1FTNT.
1FTNT stock has risen by 5.82% compared to the previous week, the month change is a −0.16% fall, over the last year Fortinet, Inc. has showed a −15.60% decrease.
We've gathered analysts' opinions on Fortinet, Inc. future price: according to them, 1FTNT price has a max estimate of 103.17 EUR and a min estimate of 56.74 EUR. Watch 1FTNT chart and read a more detailed Fortinet, Inc. stock forecast: see what analysts think of Fortinet, Inc. and suggest that you do with its stocks.
1FTNT reached its all-time high on May 7, 2025 with the price of 106.30 EUR, and its all-time low was 60.42 EUR and was reached on Aug 7, 2025. View more price dynamics on 1FTNT chart.
See other stocks reaching their highest and lowest prices.
See other stocks reaching their highest and lowest prices.
1FTNT stock is 2.16% volatile and has beta coefficient of 1.30. Track Fortinet, Inc. stock price on the chart and check out the list of the most volatile stocks — is Fortinet, Inc. there?
Today Fortinet, Inc. has the market capitalization of 55.52 B, it has increased by 1.01% over the last week.
Yes, you can track Fortinet, Inc. financials in yearly and quarterly reports right on TradingView.
Fortinet, Inc. is going to release the next earnings report on Feb 5, 2026. Keep track of upcoming events with our Earnings Calendar.
1FTNT earnings for the last quarter are 0.63 EUR per share, whereas the estimation was 0.54 EUR resulting in a 17.23% surprise. The estimated earnings for the next quarter are 0.64 EUR per share. See more details about Fortinet, Inc. earnings.
Fortinet, Inc. revenue for the last quarter amounts to 1.47 B EUR, despite the estimated figure of 1.45 B EUR. In the next quarter, revenue is expected to reach 1.60 B EUR.
1FTNT net income for the last quarter is 403.86 M EUR, while the quarter before that showed 373.60 M EUR of net income which accounts for 8.10% change. Track more Fortinet, Inc. financial stats to get the full picture.
No, 1FTNT doesn't pay any dividends to its shareholders. But don't worry, we've prepared a list of high-dividend stocks for you.
As of Dec 7, 2025, the company has 14.14 K employees. See our rating of the largest employees — is Fortinet, Inc. on this list?
EBITDA measures a company's operating performance, its growth signifies an improvement in the efficiency of a company. Fortinet, Inc. EBITDA is 1.85 B EUR, and current EBITDA margin is 32.26%. See more stats in Fortinet, Inc. financial statements.
Like other stocks, 1FTNT shares are traded on stock exchanges, e.g. Nasdaq, Nyse, Euronext, and the easiest way to buy them is through an online stock broker. To do this, you need to open an account and follow a broker's procedures, then start trading. You can trade Fortinet, Inc. stock right from TradingView charts — choose your broker and connect to your account.