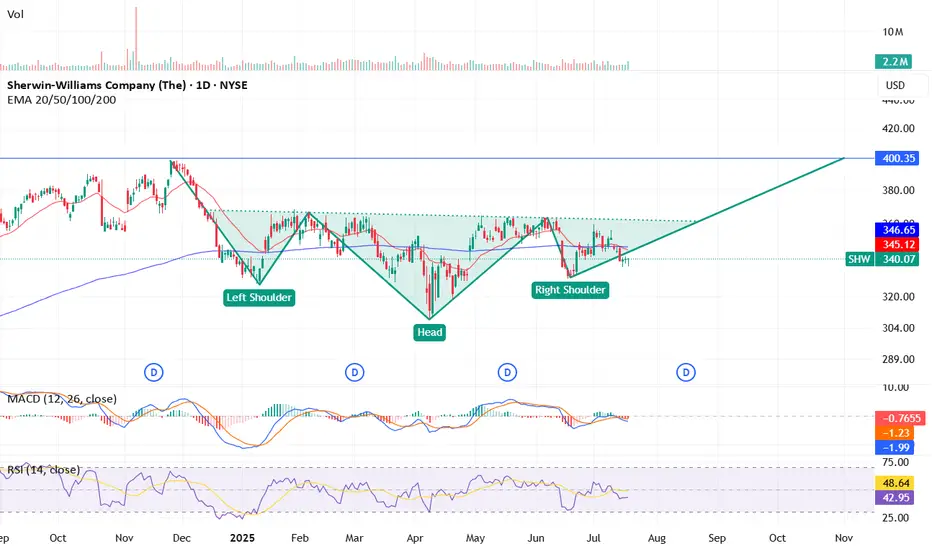
"SHW long" inverted H&S forming Technical observation is inverted head & shoulders forming with potential target to 400$ range.
p.s. Not a financial advise
Next report date
—
Report period
—
EPS estimate
—
Revenue estimate
—
8.85 EUR
2.59 B EUR
22.31 B EUR
230.14 M
About Sherwin-Williams Company (The)
Sector
Industry
CEO
Heidi G. Petz
Website
Headquarters
Cleveland
Founded
1866
ISIN
US8243481061
FIGI
BBG01K3X2C45
The Sherwin-Williams Co. engages in the development, manufacture, distribution, and sale of paint and coatings. It operates through the following segments: Paint Stores Group, Consumer Brands Group, Performance Coatings Group, and Administrative. The Paint Stores Group segment caters to the needs of architectural and industrial paint contractors and do-it-yourself homeowners. The Consumer Brands Group segment manufactures and distributes a broad portfolio of branded and private-label architectural paint, stains, varnishes and other industrial products. The Performance Coatings Group segment develops and sells industrial coatings for wood finishing and general industrial applications. The Administrative segment refers to the administrative expenses and assets of the company’s new global headquarters and research and development center, both currently under construction. The company was founded by Henry Sherwin and Edward Williams in 1866 and is headquartered in Cleveland, OH.
Related stocks
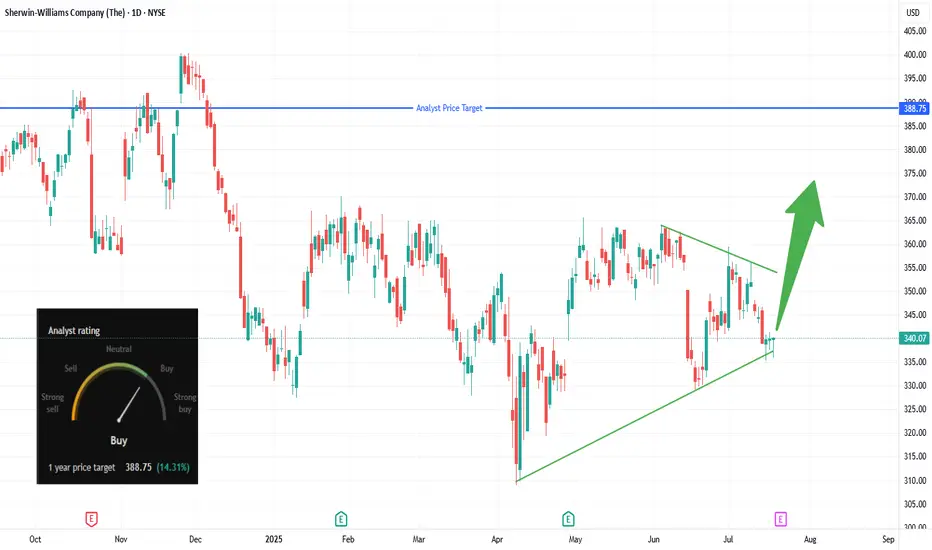
SHW Bulls Ready to Paint the Tape Green?📋 Trade Summary
Setup: Price bouncing off ascending trendline support in a tightening triangle pattern.
Entry: Market buy at ~$340
Stop-loss: Below channel support at $327.74
Targets:
Initial: $355 (trendline break)
Main: $388.75 (analyst price target)
Risk/Reward
Sherwin-Williams Stock Quote | Chart & Forecast SummaryKey Indicators On Trade Set Up In General
1. Push Set Up
2. Range Set up
3. Break & Retest Set Up
Notes On Session
# Sherwin-Williams Stock Quote
- Double Formation
* (Target Entry Or Gap Fill)) At 770.00 USD | Completed Survey
* ((No Trade)) On Reversed Settings | Subdivision 1
- Triple Formation

Sherwin Williams, you will always need paintNYSE:SHW looks good here, pushing agains multi year horizontal resistance
* ER out of the way,
* weekly bull flag break here, need to confirm the weekly close,
can buy leaps or debit spreads, half size here and add on weekly confirmation.... not financial advice ;D

shw stock buy limitwe can but entry level at this point , we must put the stop under the support shown in the graph

Sherwin-Williams | Chart & Forecast SummaryKey Indicators On Trade Set Up In General
1. Push Set Up
2. Range Set up
3. Break & Retest Set Up
Notes On Session
# Sherwin-Williams
- Double Formation
* 270.00 USD | Support Area | Subdivision 1
* Neckline | Uptrend Bias
- Triple Formation
* Flag Structure | Continuation Area Attempt | Subdivisio

$SHW with a neutral outlook following its earnings #StocksThe PEAD projected a neutral outlook for NYSE:SHW after a negative under reaction following its earnings release placing the stock in drift D with an expected accuracy of 40%.

Buy Sherwin-WilliamsShort Term Trading Advice by Naranj Capital
Buy Sherwin-Williams
● Buy Range- 366 - 371
● Target- 385 - 390
● StopLoss- 360
● Potential Return- 5-6%
● Duration- 14-15 Trading Days

$SHW - bullishNYSE:SHW -- bullish chart
Mean ^
Var ^
Autocorrelation crossed 0 into positive territory, which means trending
Last indicator shows a measure of information; the higher the information, the higher the uncertainty. You want to be trading when the indicators is decreasing.

SHW Multi-Time-Frame Squeeze SHW has a history of making outsized moves on the back of Daily Squeeze action. In the recent past, it has moved in "harmonic" 50+ point surges. If the next daily squeeze fires long, I look for it to run up to it's prior high at $354. If it behaves like it did last quarter, this could happen on t

See all ideas
Summarizing what the indicators are suggesting.
Neutral
SellBuy
Strong sellStrong buy
Strong sellSellNeutralBuyStrong buy
Neutral
SellBuy
Strong sellStrong buy
Strong sellSellNeutralBuyStrong buy
Neutral
SellBuy
Strong sellStrong buy
Strong sellSellNeutralBuyStrong buy
An aggregate view of professional's ratings.
Neutral
SellBuy
Strong sellStrong buy
Strong sellSellNeutralBuyStrong buy
Neutral
SellBuy
Strong sellStrong buy
Strong sellSellNeutralBuyStrong buy
Neutral
SellBuy
Strong sellStrong buy
Strong sellSellNeutralBuyStrong buy
Displays a symbol's price movements over previous years to identify recurring trends.
Frequently Asked Questions
The current price of 1SHW is 299.55 EUR — it has decreased by −1.50% in the past 24 hours. Watch Sherwin-Williams Company stock price performance more closely on the chart.
Depending on the exchange, the stock ticker may vary. For instance, on MIL exchange Sherwin-Williams Company stocks are traded under the ticker 1SHW.
1SHW stock has risen by 3.74% compared to the previous week, the month change is a 2.38% rise, over the last year Sherwin-Williams Company has showed a −9.79% decrease.
We've gathered analysts' opinions on Sherwin-Williams Company future price: according to them, 1SHW price has a max estimate of 363.73 EUR and a min estimate of 297.36 EUR. Watch 1SHW chart and read a more detailed Sherwin-Williams Company stock forecast: see what analysts think of Sherwin-Williams Company and suggest that you do with its stocks.
1SHW reached its all-time high on Dec 3, 2024 with the price of 385.20 EUR, and its all-time low was 237.40 EUR and was reached on Nov 10, 2023. View more price dynamics on 1SHW chart.
See other stocks reaching their highest and lowest prices.
See other stocks reaching their highest and lowest prices.
1SHW stock is 1.52% volatile and has beta coefficient of 0.69. Track Sherwin-Williams Company stock price on the chart and check out the list of the most volatile stocks — is Sherwin-Williams Company there?
Today Sherwin-Williams Company has the market capitalization of 73.92 B, it has increased by 2.06% over the last week.
Yes, you can track Sherwin-Williams Company financials in yearly and quarterly reports right on TradingView.
Sherwin-Williams Company is going to release the next earnings report on Jan 22, 2026. Keep track of upcoming events with our Earnings Calendar.
1SHW earnings for the last quarter are 3.06 EUR per share, whereas the estimation was 2.94 EUR resulting in a 4.07% surprise. The estimated earnings for the next quarter are 1.88 EUR per share. See more details about Sherwin-Williams Company earnings.
Sherwin-Williams Company revenue for the last quarter amounts to 5.42 B EUR, despite the estimated figure of 5.29 B EUR. In the next quarter, revenue is expected to reach 4.79 B EUR.
1SHW net income for the last quarter is 709.96 M EUR, while the quarter before that showed 640.67 M EUR of net income which accounts for 10.82% change. Track more Sherwin-Williams Company financial stats to get the full picture.
Yes, 1SHW dividends are paid quarterly. The last dividend per share was 0.68 EUR. As of today, Dividend Yield (TTM)% is 0.89%. Tracking Sherwin-Williams Company dividends might help you take more informed decisions.
Sherwin-Williams Company dividend yield was 0.84% in 2024, and payout ratio reached 27.10%. The year before the numbers were 0.78% and 26.17% correspondingly. See high-dividend stocks and find more opportunities for your portfolio.
As of Nov 2, 2025, the company has 63.89 K employees. See our rating of the largest employees — is Sherwin-Williams Company on this list?
EBITDA measures a company's operating performance, its growth signifies an improvement in the efficiency of a company. Sherwin-Williams Company EBITDA is 3.81 B EUR, and current EBITDA margin is 19.04%. See more stats in Sherwin-Williams Company financial statements.
Like other stocks, 1SHW shares are traded on stock exchanges, e.g. Nasdaq, Nyse, Euronext, and the easiest way to buy them is through an online stock broker. To do this, you need to open an account and follow a broker's procedures, then start trading. You can trade Sherwin-Williams Company stock right from TradingView charts — choose your broker and connect to your account.
Investing in stocks requires a comprehensive research: you should carefully study all the available data, e.g. company's financials, related news, and its technical analysis. So Sherwin-Williams Company technincal analysis shows the buy rating today, and its 1 week rating is neutral. Since market conditions are prone to changes, it's worth looking a bit further into the future — according to the 1 month rating Sherwin-Williams Company stock shows the sell signal. See more of Sherwin-Williams Company technicals for a more comprehensive analysis.
If you're still not sure, try looking for inspiration in our curated watchlists.
If you're still not sure, try looking for inspiration in our curated watchlists.