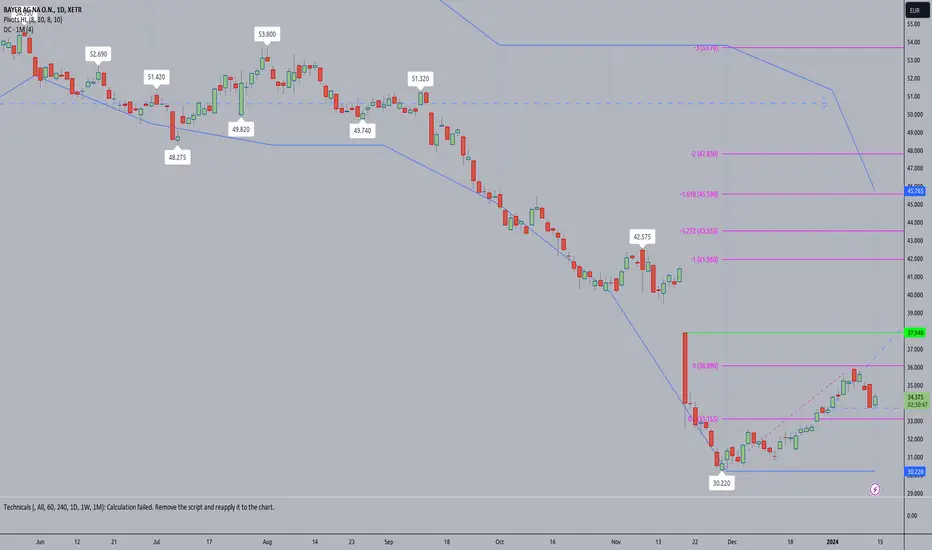
Bayer double bottom Bayer was trending down for last almost a year. Now it's seems to draw the double botton. Stock found the support, bounce twice and seems to be recovering. Moreover, the dividend is incomingin near future what could boost the price additionally.
this is not a recomendation, only my guess what could
−2.995EUR
−2.94 BEUR
47.64 BEUR
952.09 M
About BAYER
Sector
CEO
William N. Anderson
Headquarters
Leverkusen
Website
Employees (FY)
99.72 K
Founded
1952
ISIN
DE000BAY0017
FIGI
BBG000GWH1F4
Bayer AG engages in the business of life science fields of healthcare and nutrition. It operates through the following segments: Crop Science, Pharmaceuticals, and Consumer Health. The Crop Science segment includes developing, producing, and marketing products in seeds and plant traits, crop protection, digital solutions, and customer services to promote sustainable agriculture. The Pharmaceuticals segment is involved in prescription products especially for cardiology and women’s health; specialty therapeutics in the areas of oncology, hematology, ophthalmology, and cell and gene therapy; diagnostic imaging equipment; and necessary contrast agents. The Consumer Health segment focuses on non-prescription products in the dermatology, nutritional supplements, digestive health, allergy, cough and cold, and pain and cardiovascular risk prevention categories. The company was founded by Friedrich Bayer and Johann Friedrich Westkott on August 1, 1863 and is headquartered in Leverkusen, Germany.

If Germany is the sick man of Europe. #Bayer looking deathlyThe #EU is Marxist, Socialist, and is involved in Price setting
That didn't work out too well for USSR as economic powerhouse
and so too we see the once great German economy being brought to it's knees.
It is being de-industralized and being brought down in a great economic levelling of the union

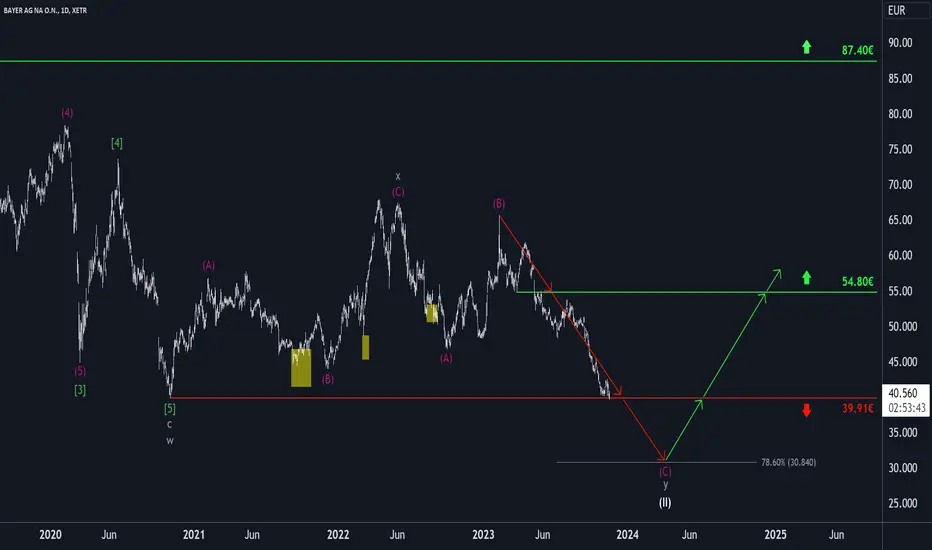
Bayer (BAYN): End of a long 9-year correctionBayer (BAYN): XETR:BAYN
Upon request from one of our members, we're taking a closer look at Bayer AG. We believe that we are still in an overarching Wave II. This wave finds its last true support at the 88.2% retracement level at €24.51. Falling significantly below this level would likely lead

Bayer Cuts Dividends to Reduce DebtIn a strategic move to tackle its mounting debt and enhance financial flexibility, Bayer ( OTC:BAYRY ), the German pharmaceutical giant, has announced a significant shift in its dividend policy. The decision, though met with mixed reactions from investors and analysts, underscores the company's comm

Buy Bayer AG Scalp and HOLDHello, here my IDEA for BAYER AG, a big player in Germany
and WORLDWIDE. Make 3 Position and take the Profits, for Longtime
Investors BUY and HOLD.

BAYN: Potential BuyRetesting the channel price recently broke out of, this represents a possible buy opportunity backed with a recent insider buying activity. First target right after the gap where you could take partials, then 48 EUR. If you believe in the company why not hold to ATH.

BAYN Entry ZoneBayer has reached a Fibonacci entry zone after yesterday's fall.
There is a window to be closed that has been opened at the fall on November 20th.
BAYER AG: $40.60 | Aspirin AlkaSeltzer Monsanto + $11bn Settled Bill Anderson doing the roadshow in Dc and Carlyle Group seems to be
going in heavy at current levels or lower for the next RUN UP
a long game to make a killing for heavy hitters in the pharma bio agri chemical business
the timing to position for such a deal takes time and feel in the this type of

Bayer: Down the hatch! 🍺After Bayer's stock recently tried to break through the support level of €39.91, it has now made another attempt. Whether the stock succeeds in sustainably breaking below this support level - as envisaged in our primary scenario - or whether it needs further impetus in the form of a corrective upwar
Why Bayer Stock is a Great Long-Term Investment OpportunityBayer AG is a German multinational pharmaceutical and life sciences company founded in 1863. The company is headquartered in Leverkusen, Germany, and employs over 100,000 people worldwide. Bayer's core business areas are human and veterinary pharmaceuticals, consumer healthcare products, agricultura

See all ideas
Trade directly on the supercharts through our supported, fully-verified and user-reviewed brokers.


Curated watchlists where 1BAYN is featured.

Frequently Asked Questions
The current price of 1BAYN is 27.230 EUR — it has decreased by 0.26% in the past 24 hours.
Depending on the exchange, the stock ticker may vary. For instance, on MIL exchange BAYER stocks are traded under the ticker 1BAYN.
BAYER is going to release the next earnings report on May 14, 2024. Keep track of upcoming events with our Earnings Calendar.
1BAYN stock is 0.98% volatile and has beta coefficient of 0.91. Check out the list of the most volatile stocks — is BAYER there?
1BAYN earnings for the last quarter are 0.38 EUR per share, whereas the estimation was 0.76 EUR resulting in a −49.97% surprise. The estimated earnings for the next quarter are 1.44 EUR per share. See more details about BAYER earnings.
BAYER revenue for the last quarter amounts to 10.34 B EUR despite the estimated figure of 10.61 B EUR. In the next quarter revenue is expected to reach 11.70 B EUR.
Yes, you can track BAYER financials in yearly and quarterly reports right on TradingView.
1BAYN stock has risen by 4.75% compared to the previous week, the month change is a 1.32% rise, over the last year BAYER has showed a 54.69% decrease.
1BAYN net income for the last quarter is 1.34 B EUR, while the quarter before that showed −4.57 B EUR of net income which accounts for 129.26% change. Track more BAYER financial stats to get the full picture.
Today BAYER has the market capitalization of 26.86 B, it has decreased by 3.45% over the last week.
Yes, 1BAYN dividends are paid annually. The last dividend per share was 2.40 EUR. As of today, Dividend Yield (TTM)% is 8.78%. Tracking BAYER dividends might help you take more informed decisions.
Like other stocks, 1BAYN shares are traded on stock exchanges, e.g. Nasdaq, Nyse, Euronext, and the easiest way to buy them is through an online stock broker. To do this, you need to open an account and follow a broker's procedures, then start trading. You can trade BAYER stock right from TradingView charts — choose your broker and connect to your account.
As of Apr 24, 2024, the company has 99.72 K employees. See our rating of the largest employees — is BAYER on this list?
Investing in stocks requires a comprehensive research: you should carefully study all the available data, e.g. company's financials, related news, and its technical analysis. So BAYER technincal analysis shows the sell today, and its 1 week rating is sell. Since market conditions are prone to changes, it's worth looking a bit further into the future — according to the 1 month rating BAYER stock shows the sell signal. See more of BAYER technicals for a more comprehensive analysis.
If you're still not sure, try looking for inspiration in our curated watchlists.
If you're still not sure, try looking for inspiration in our curated watchlists.
We've gathered analysts' opinions on BAYER future price: according to them, 1BAYN price has a max estimate of 61.00 EUR and a min estimate of 25.00 EUR. Read a more detailed BAYER forecast: see what analysts think of BAYER and suggest that you do with its stocks.
EBITDA measures a company's operating performance, its growth signifies an improvement in the efficiency of a company. BAYER EBITDA is 12.12 B EUR, and current EBITDA margin is 25.91%. See more stats in BAYER financial statements.