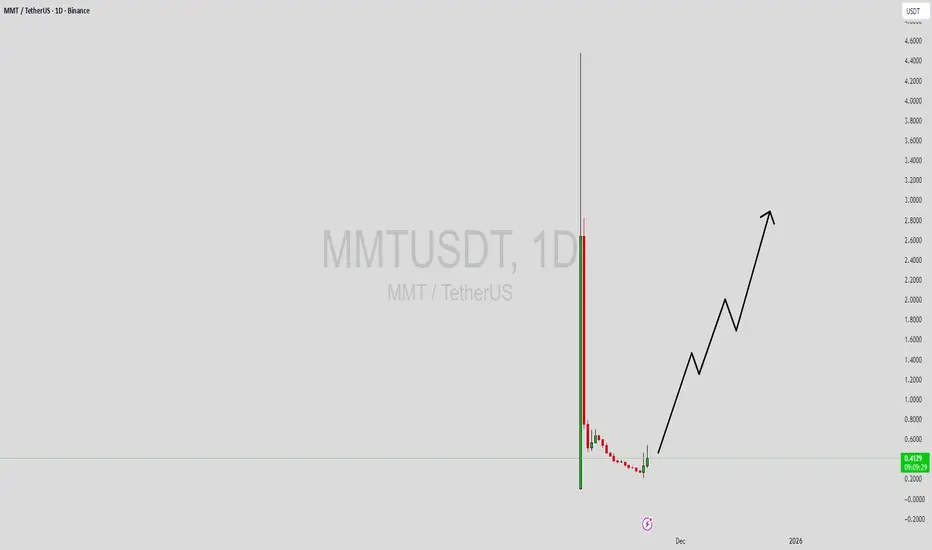
MMTUSDT Forming Bullish WaveMMTUSDT is forming a clear bullish wave pattern on the daily and 4-hour charts, a powerful continuation signal that underscores surging momentum in the Sui DeFi ecosystem amid late 2025's altcoin volatility. The price has been advancing through a series of higher highs and higher lows around $0.40,
MMT Analysis (2H)On the higher timeframes, we are in a large bearish structure, but on the lower timeframes the structure has turned bullish, and it is expected to continue moving until all the marked liquidity on the chart is collected. There is a strong pivot on the chart, and the probability of the price getting

Scalp Long – MMT📈 Scalp Long – MMT
Price is holding at a strong support zone after completing a clean breakout and successful retest. Consecutive bullish divergences have appeared, signaling potential upward momentum.
🎯 Trade Setup:
Take Profit (TP): 0.491
Stop Loss (SL): 0.4074
Risk/Reward Ratio (RR): 1 : 2.7

MmtMmt can reach to upper level
And it is bullish completely
Trex group
Tanx alot Mr khakestar
Master of Trex

MMTUSDT IdeaHey traders, its my view!
Short-Term Scenario for next 1–4 hours:
Entry: $0.52 – $0.54 Need current consolidation
Target 1: $0.79
Target 2: $1.60
Stop Loss: Below $0.47
Mid-Term Scenario (4–12 hours:
If price breaks and holds above $1.60:
Target 3: $2.58
Confirmation needed from MACD bullish crossov

Momentum MMT/USDT Support and Resistance LevelsThis post identifies the main support and resistance zones for the Momentum MMT/USDT pair. It summarizes recent price structure and key reaction levels. This is not financial advice. It is only a technical analysis provided for informational purposes.

See all ideas
Summarizing what the indicators are suggesting.
Oscillators
Neutral
SellBuy
Strong sellStrong buy
Strong sellSellNeutralBuyStrong buy
Oscillators
Neutral
SellBuy
Strong sellStrong buy
Strong sellSellNeutralBuyStrong buy
Summary
Neutral
SellBuy
Strong sellStrong buy
Strong sellSellNeutralBuyStrong buy
Summary
Neutral
SellBuy
Strong sellStrong buy
Strong sellSellNeutralBuyStrong buy
Summary
Neutral
SellBuy
Strong sellStrong buy
Strong sellSellNeutralBuyStrong buy
Moving Averages
Neutral
SellBuy
Strong sellStrong buy
Strong sellSellNeutralBuyStrong buy
Moving Averages
Neutral
SellBuy
Strong sellStrong buy
Strong sellSellNeutralBuyStrong buy