Paramount (PARA) Flirting with Historical Support, Time to Buy?Hi Guys. As usual always on the lookout for Macro trend setups, signs and opportunities. PARA seems to be in a position of low risk trade setup.
We have made it to a Historical Support level, where interactions here normally leads to bounces upward.
Please note however that previous history does
−1.69USD
−1.05 BUSD
29.65 BUSD
588.35 M
About Paramount Global
Sector
Industry
CEO
Robert Marc Bakish
Website
Headquarters
New York
Employees (FY)
21.9 K
Founded
1986
ISIN
US92556H2067
FIGI
BBG000C496P7
Paramount Global operates as a mass media company, which creates and distributes content across a variety of platforms to audiences around the world. It operates its business through the following segments: Entertainment, Cable Networks, Publishing, and Local Media. The Entertainment segment is composed of the CBS Television Network, CBS Television Studios, CBS Studios International, CBS Television Distribution, CBS Interactive, and CBS Films, as well as the company's digital streaming services, CBS All Access and CBSN. The Cable Networks segment includes Showtime Networks, CBS Sports Network, and Smithsonian Networks. The Publishing segment manages Simon & Schuster's consumer book publishing business with imprints such as Simon & Schuster, Pocket Books, Scribner, and Atria Books. The Local Media segment handles CBS Television Stations and CBS Local Digital Media, with revenues generated primarily from advertising sales and retransmission fees. The company was founded by Sumner Murray Redstone in 1986 and is headquartered in New York, NY.

Paramount stock slumps 8.51% on request of Equity RaiseParamount Global's ( NASDAQ:PARA ) shares plummeted by 8% on Thursday following news reports that it may require an infusion of new equity of up to $3 billion to merge with Skydance Media. The reports are based on information provided by sources familiar with the deal. The founder of Skydance Media,

Paramount Stock Spikes 15% Amidst Merger Talks With SkydanceParamount Global ( NASDAQ:PARA ), the media conglomerate housing iconic assets such as Paramount Pictures, CBS network, and a slew of cable networks, finds itself at a crossroads. Recent developments hint at a potential sale, raising questions about the future of one of the entertainment industry's
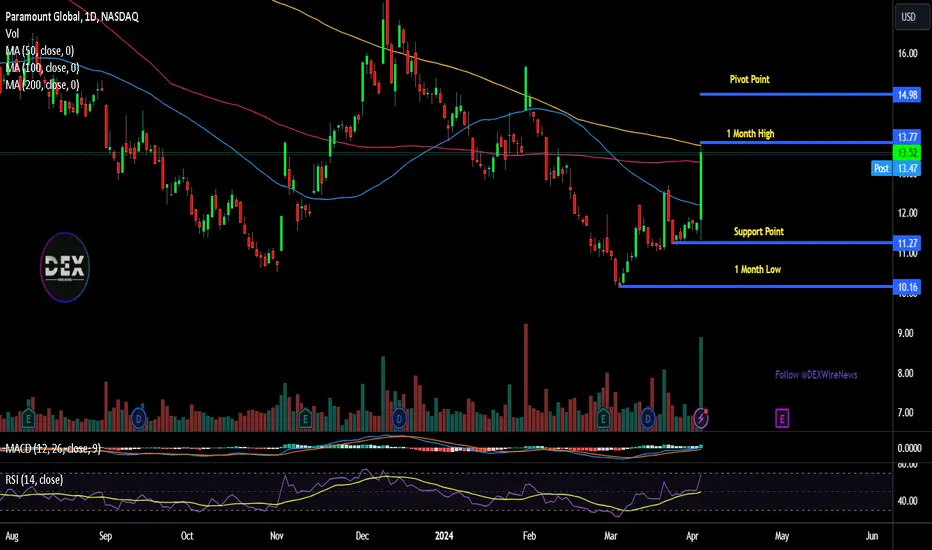
Harmonic pattern for PARA. It seems that NASDAQ:PARA is ready to fly.
A harmonic pattern is observed on the daily chart and double bottom at around 10.25.
The sentiments around the PARA is positive as traders waiting for a deal for take over.
The awesome indicator is also showing a bullish trend.
First target price is 14.73

Apollo's Set to Acquire Paramount' Pictures for $11 BillionIn a move that sent shockwaves through the entertainment industry, private equity firm Apollo Global Management has reportedly tabled an eye-watering $11 billion offer for Paramount Global's coveted film studio, Paramount Pictures ( NASDAQ:PARA ). This bid, shrouded in intrigue and speculation, adds

PARA Paramount Global Options Ahead of EarningsAnalyzing the options chain and the chart patterns of PARA Paramount Global prior to the earnings report this week,
I would consider purchasing the 12.50usd strike price Calls with
an expiration date of 2024-6-21,
for a premium of approximately $1.15.
If these options prove to be profitable prior t

RiskMastery's Breakout Stocks - PARAA EditionWelcome to RiskMastery's Breakout Stocks - Stocks with breakout potential.
In this edition, we'll be looking at NASDAQ:PARAA ...
I believe this code is at a point of potential volatility.
If price can hold above $23.06 ... Bullish potential may be unlocked.
My key upside targets inclu


PARAMOUNT: The Golden Cross won't save it. Strong short.Paramount is technically at the very high bullish levels on the 1D timeframe (RSI = 67.184, MACD = 49.860, ADX = 37.093) and just formed the first 4H Golden Cross since January 30th 2023. Being very close to the top of almost a 2 year Channel Down, this rise appears to be coming to an end. Being fai

Paramount Shares Jump After Reports of Takeover InterestParamount Global shares surged Today following reports from Deadline and Puck News that Skydance and Redbird Capital were exploring potentially taking over the media giant.
Paramount’s controlling shareholder, Shari Redstone, has been open to making big deals, especially as the company weathers the

See all ideas
Trade directly on the supercharts through our supported, fully-verified and user-reviewed brokers.


Curated watchlists where PARA is featured.


Frequently Asked Questions
The current price of PARA is 10.88 USD — it has increased by 0.65% in the past 24 hours.
Depending on the exchange, the stock ticker may vary. For instance, on NASDAQ exchange Paramount Global stocks are traded under the ticker PARA.
Paramount Global is going to release the next earnings report on Apr 29, 2024. Keep track of upcoming events with our Earnings Calendar.
PARA stock is 1.58% volatile and has beta coefficient of 1.94. Check out the list of the most volatile stocks — is Paramount Global there?
One year price forecast for Paramount Global has a max estimate of 19.00 USD and a min estimate of 9.00 USD.
PARA earnings for the last quarter are 0.30 USD whereas the estimation was 0.12 USD which accounts for 155.72% surprise. Estimated earnings for the next quarter are −0.01 USD. See more details about Paramount Global earnings.
Paramount Global revenue for the last quarter amounts to 7.13 B USD despite the estimated figure of 7.12 B USD. In the next quarter revenue is expected to reach 7.83 B USD.
Yes, you can track Paramount Global financials in yearly and quarterly reports right on TradingView.
PARA stock has risen by 2.64% compared to the previous week, the month change is a 1.98% fall, over the last year Paramount Global has showed a 49.51% decrease.
PARA net income for the last quarter is 77.00 M USD, while the quarter before that showed 295.00 M USD of net income which accounts for −73.90% change. Track more Paramount Global financial stats to get the full picture.
Today Paramount Global has the market capitalization of 7.18 B, it has decreased by 3.91% over the last week.
Yes, PARA dividends are paid quarterly. The last dividend per share was 0.05 USD. As of today, Dividend Yield (TTM)% is 1.85%. Tracking Paramount Global dividends might help you take more informed decisions.
Like other stocks, PARA shares are traded on stock exchanges, e.g. Nasdaq, Nyse, Euronext, and the easiest way to buy them is through an online stock broker. To do this, you need to open an account and follow a broker's procedures, then start trading. You can trade Paramount Global stock right from TradingView charts — choose your broker and connect to your account.
As of Apr 18, 2024, the company has 21.90 K employees. See our rating of the largest employees — is Paramount Global on this list?
Investing in stocks requires a comprehensive research: you should carefully study all the available data, e.g. company's financials, related news, and its technical analysis. So Paramount Global technincal analysis shows the sell today, and its 1 week rating is strong sell. Since market conditions are prone to changes, it's worth looking a bit further into the future — according to the 1 month rating Paramount Global stock shows the sell signal. See more of Paramount Global technicals for a more comprehensive analysis.
If you're still not sure, try looking for inspiration in our curated watchlists.
If you're still not sure, try looking for inspiration in our curated watchlists.
We've gathered analysts' opinions on Paramount Global future price: according to them, PARA price has a max estimate of 19.00 USD and a min estimate of 9.00 USD. Read a more detailed Paramount Global forecast: see what analysts think of Paramount Global and suggest that you do with its stocks.
EBITDA measures a company's operating performance, its growth signifies an improvement in the efficiency of a company. Paramount Global EBITDA is 19.00 M USD, and current EBITDA margin is 0.06%. See more stats in Paramount Global financial statements.