1.26USD
34.15 MUSD
296.59 MUSD
24.74 M
About The Hackett Group, Inc.
Sector
CEO
Ted A. Fernandez
Website
Headquarters
Miami
Employees (FY)
1.35 K
Founded
1991
ISIN
US4046091090
FIGI
BBG000BBLQV7
The Hackett Group, Inc. engages in the provision of dedicated expertise in generative artificial intelligence strategy, operations, finance, human capital management, strategic sourcing, procurement, and information technology. It operates through the following segments: Global Strategy & Business Transformation (S and BT), Oracle Solutions, and SAP Solutions. The Global S and BT segment includes the results of the company’s strategic business consulting practices. The Oracle Solutions segment is involved in oracle enterprise performance management, enterprise resource planning, and application maintenance and support practices. The SAP Solutions segment focuses on the SAP applications and related SAP service offerings. The company was founded by Ted A. Fernandez and David N. Dungan in 1991 and is headquartered in Miami, FL.

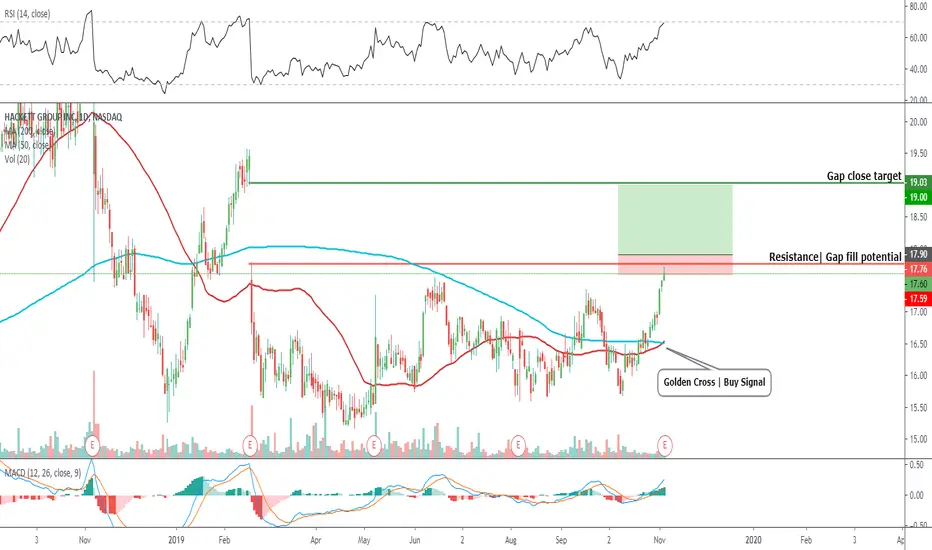
Major Breakout. Back test complete next stop mid 30sFalse breakdown on monthly. Flag breakout on daily chart coming off of double botttom. Back test complete next stop mid 30s

$HCKT Trade the gap in Hackett GroupEntry level $17.90 = Target price $19.00 = Stop loss $17.60
Nice opportunity for a gap fill trade in a strong stock on a bull run, very nice risk / reward trade.
Bullish golden cross occurring , which is a much sought after buy signal.
RSI making a higher high and has room to run higher.
Company pr
See all ideas
Trade directly on the supercharts through our supported, fully-verified and user-reviewed brokers.


Frequently Asked Questions
The current price of HCKT is 22.60 USD — it has increased by 0.58% in the past 24 hours.
Depending on the exchange, the stock ticker may vary. For instance, on NASDAQ exchange The Hackett Group, Inc. stocks are traded under the ticker HCKT.
The Hackett Group, Inc. is going to release the next earnings report on May 7, 2024. Keep track of upcoming events with our Earnings Calendar.
HCKT stock is 1.16% volatile and has beta coefficient of 1.07. Check out the list of the most volatile stocks — is The Hackett Group, Inc. there?
One year price forecast for The Hackett Group, Inc. has a max estimate of 28.00 USD and a min estimate of 28.00 USD.
HCKT earnings for the last quarter are 0.41 USD per share, whereas the estimation was 0.39 USD resulting in a 4.24% surprise. The estimated earnings for the next quarter are 0.37 USD per share. See more details about The Hackett Group, Inc. earnings.
The Hackett Group, Inc. revenue for the last quarter amounts to 74.63 M USD despite the estimated figure of 73.44 M USD. In the next quarter revenue is expected to reach 69.65 M USD.
Yes, you can track The Hackett Group, Inc. financials in yearly and quarterly reports right on TradingView.
HCKT stock has fallen by 2.50% compared to the previous week, the month change is a 6.57% fall, over the last year The Hackett Group, Inc. has showed a 21.44% increase.
HCKT net income for the last quarter is 7.85 M USD, while the quarter before that showed 9.42 M USD of net income which accounts for −16.67% change. Track more The Hackett Group, Inc. financial stats to get the full picture.
Today The Hackett Group, Inc. has the market capitalization of 620.11 M, it has decreased by 1.78% over the last week.
Yes, HCKT dividends are paid quarterly. The last dividend per share was 0.11 USD. As of today, Dividend Yield (TTM)% is 1.96%. Tracking The Hackett Group, Inc. dividends might help you take more informed decisions.
The Hackett Group, Inc. dividend yield was 1.93% in 2023, and payout ratio reached 35.61%. The year before the numbers were 2.16% and 34.47% correspondingly. See high-dividend stocks and find more opportunities for your portfolio.
Like other stocks, HCKT shares are traded on stock exchanges, e.g. Nasdaq, Nyse, Euronext, and the easiest way to buy them is through an online stock broker. To do this, you need to open an account and follow a broker's procedures, then start trading. You can trade The Hackett Group, Inc. stock right from TradingView charts — choose your broker and connect to your account.
As of Apr 19, 2024, the company has 1.35 K employees. See our rating of the largest employees — is The Hackett Group, Inc. on this list?
Investing in stocks requires a comprehensive research: you should carefully study all the available data, e.g. company's financials, related news, and its technical analysis. So The Hackett Group, Inc. technincal analysis shows the sell today, and its 1 week rating is sell. Since market conditions are prone to changes, it's worth looking a bit further into the future — according to the 1 month rating The Hackett Group, Inc. stock shows the buy signal. See more of The Hackett Group, Inc. technicals for a more comprehensive analysis.
If you're still not sure, try looking for inspiration in our curated watchlists.
If you're still not sure, try looking for inspiration in our curated watchlists.
We've gathered analysts' opinions on The Hackett Group, Inc. future price: according to them, HCKT price has a max estimate of 28.00 USD and a min estimate of 28.00 USD. Read a more detailed The Hackett Group, Inc. forecast: see what analysts think of The Hackett Group, Inc. and suggest that you do with its stocks.
EBITDA measures a company's operating performance, its growth signifies an improvement in the efficiency of a company. The Hackett Group, Inc. EBITDA is 53.86 M USD, and current EBITDA margin is 18.16%. See more stats in The Hackett Group, Inc. financial statements.