Semi-conductor manufacturingMKS Instruments enables technologies that transform our world. We deliver foundational technology solutions to leading-edge semiconductor manufacturing, electronics and packaging, and specialty industrial applications.
We are too focused on semiconductor design companies but neglect to look at the
−27.55USD
−1.84 BUSD
3.62 BUSD
66.72 M
About MKS Instruments, Inc.
Sector
Industry
CEO
Tseng Chung Lee
Website
Headquarters
Andover
Employees (FY)
10.2 K
Founded
1961
ISIN
US55306N1046
FIGI
BBG000BVMG26
MKS Instruments, Inc. provides instruments, systems, subsystems and process control solutions to measure, control, power, monitor, and analyze parameters of manufacturing processes to improve process performance and productivity for its customers. It operates through the following segments: Vacuum & Analysis, Light & Motion and Equipment & Solutions. The Vacuum & Analysis segment comprises pressure measurement and control, flow measurement and control, gas and vapor delivery, gas composition analysis, residual gas analysis, leak detection, control technology, ozone generation and delivery, RF & DC power, reactive gas generation and vacuum technology components. The Light & Motion segment includes lasers, photonics, sub-micron positioning, vibration control, and optics instruments. The Equipment & Solutions segment provides laser-based manufacturing systems solutions for the micro-machining industry that enable customers to optimize production. The company was founded in 1961 and is headquartered in Andover, MA.


Long for MKS Instrument For fiscal year-end 31/12/2020, MKS Instrument revenue has increased significantly by 22.65%. Net income increase by 149.38%. QoQ has steadily increased and the incoming quarter report has been forecast to have a significant increment. This company have strong financial fundamental and will be good

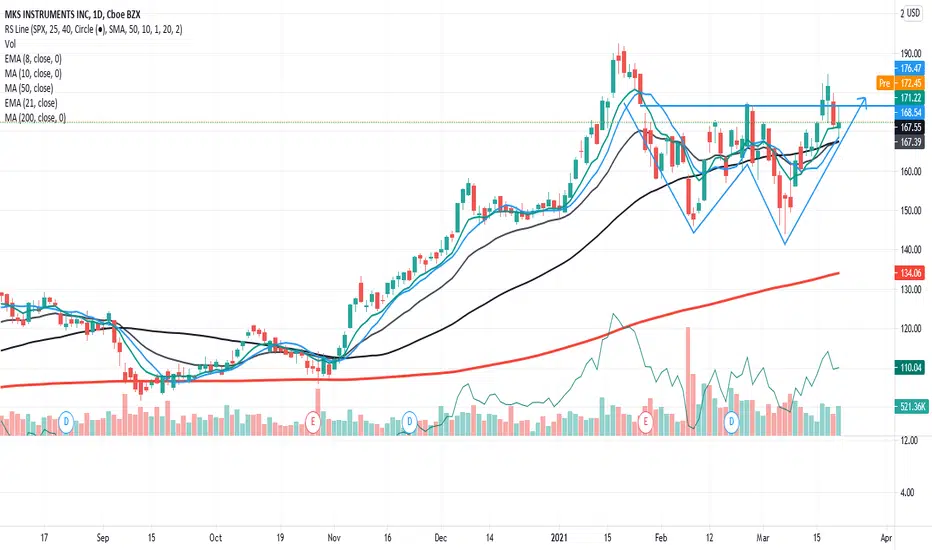
$MKSI Ready to Blast Out of a Double Bottom?Double bottoms have a nice success rate once they clear the top of the "W" high which in this case would either be $184.69 or the more proper buy point of $192.30. I like an early entry so I've set an alert just above Friday's high (3/19). If / when it alerts me I'll be looking for some volume and a


$MKSI with a slight bullish projection after earnings$MKSI posted a marginal positive earnings with the PEAD projecting a slight bullish outllook for the stock. Price is currently trading around the Median line.
If you would like to see the Drift for another stock please message us. Also click on the Like Button if this was useful and follow us or jo

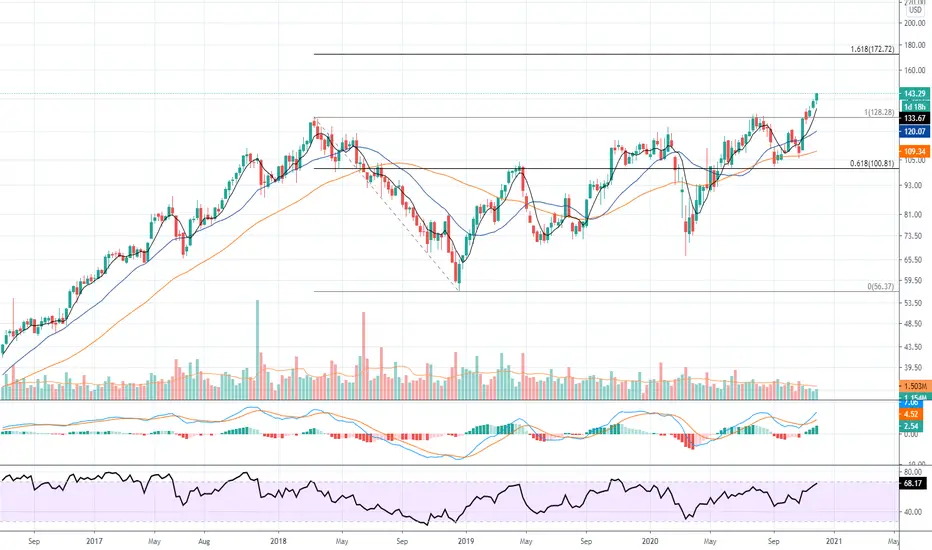
Cup and Handle Ascending TriangleEarnings are over for the quarter for this one
Broke resistance from long ago high at 122.67 May be a support level later on
Be safe above all! Not a recommendation

See all ideas
Trade directly on the supercharts through our supported, fully-verified and user-reviewed brokers.


Frequently Asked Questions
The current price of MKSI is 114.80 USD — it has decreased by 4.71% in the past 24 hours.
Depending on the exchange, the stock ticker may vary. For instance, on NASDAQ exchange MKS Instruments, Inc. stocks are traded under the ticker MKSI.
MKS Instruments, Inc. is going to release the next earnings report on May 8, 2024. Keep track of upcoming events with our Earnings Calendar.
MKSI stock is 5.62% volatile and has beta coefficient of 1.99. Check out the list of the most volatile stocks — is MKS Instruments, Inc. there?
One year price forecast for MKS Instruments, Inc. has a max estimate of 140.00 USD and a min estimate of 120.00 USD.
MKSI earnings for the last quarter are 1.46 USD whereas the estimation was 1.02 USD which accounts for 42.85% surprise. Estimated earnings for the next quarter are 0.84 USD. See more details about MKS Instruments, Inc. earnings.
MKS Instruments, Inc. revenue for the last quarter amounts to 932.00 M USD despite the estimated figure of 931.50 M USD. In the next quarter revenue is expected to reach 845.25 M USD.
Yes, you can track MKS Instruments, Inc. financials in yearly and quarterly reports right on TradingView.
MKSI stock has fallen by 8.51% compared to the previous week, the month change is a 6.82% fall, over the last year MKS Instruments, Inc. has showed a 38.80% increase.
MKSI net income for the last quarter is −68.00 M USD, while the quarter before that showed 39.00 M USD of net income which accounts for −274.36% change. Track more MKS Instruments, Inc. financial stats to get the full picture.
Today MKS Instruments, Inc. has the market capitalization of 7.70 B, it has decreased by 1.24% over the last week.
Yes, MKSI dividends are paid quarterly. The last dividend per share was 0.22 USD. As of today, Dividend Yield (TTM)% is 0.77%. Tracking MKS Instruments, Inc. dividends might help you take more informed decisions.
Like other stocks, MKSI shares are traded on stock exchanges, e.g. Nasdaq, Nyse, Euronext, and the easiest way to buy them is through an online stock broker. To do this, you need to open an account and follow a broker's procedures, then start trading. You can trade MKS Instruments, Inc. stock right from TradingView charts — choose your broker and connect to your account.
As of Apr 18, 2024, the company has 10.20 K employees. See our rating of the largest employees — is MKS Instruments, Inc. on this list?
Investing in stocks requires a comprehensive research: you should carefully study all the available data, e.g. company's financials, related news, and its technical analysis. So MKS Instruments, Inc. technincal analysis shows the sell today, and its 1 week rating is buy. Since market conditions are prone to changes, it's worth looking a bit further into the future — according to the 1 month rating MKS Instruments, Inc. stock shows the buy signal. See more of MKS Instruments, Inc. technicals for a more comprehensive analysis.
If you're still not sure, try looking for inspiration in our curated watchlists.
If you're still not sure, try looking for inspiration in our curated watchlists.
We've gathered analysts' opinions on MKS Instruments, Inc. future price: according to them, MKSI price has a max estimate of 140.00 USD and a min estimate of 120.00 USD. Read a more detailed MKS Instruments, Inc. forecast: see what analysts think of MKS Instruments, Inc. and suggest that you do with its stocks.
EBITDA measures a company's operating performance, its growth signifies an improvement in the efficiency of a company. MKS Instruments, Inc. EBITDA is 779.00 M USD, and current EBITDA margin is 21.37%. See more stats in MKS Instruments, Inc. financial statements.