MYR Group Inc Announces New $75 Million Share Repurchase ProgramMYRG: MYR Group, Inc.
2022-05-04 16:09:42
MYR Group Inc. Announces New $75 Million Share Repurchase Program
5.45USD
90.99 MUSD
3.64 BUSD
16.35 M
About MYR Group, Inc.
Sector
Industry
CEO
Richard S. Swartz
Website
Headquarters
Thornton
Employees (FY)
9 K
Founded
1995
ISIN
US55405W1045
FIGI
BBG000BC7VW9
MYR Group, Inc. is a holding company, which engages in the provision of electrical construction services. It operates through the Transmission and Distribution (T&D) and Commercial and Industrial (C&I) segments. The T&D segment offers a range of services on electric transmission and distribution networks and substation facilities. The C&I segment includes the design, installation, maintenance and repair of commercial and industrial wiring, installation of traffic networks and the installation of bridge, roadway, and tunnel lighting. The company was founded in 1995 and is headquartered in Thornton, CO.

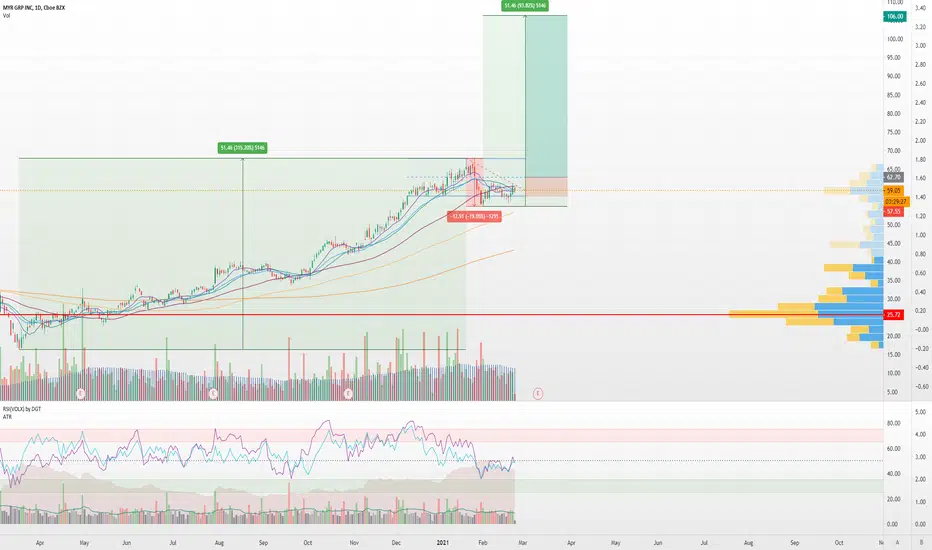
MYRG joins list of my near-term shortsI have changed up how to best display projected movement. In the case of MYRG, 5 of my algorithms signaled a SELL on March 19, 2021. Equities nearly always obey the signal and move down, but sometimes it may continue to move up first.
I have placed two red boxes and two green boxes on the chart. Th

MYRGFirst Idea was a bit of a reach so updating it
MYR Group, Inc. is a holding company, which engages in the provision of electrical construction services. It operates through the Transmission and Distribution (T&D); and Commercial and Industrial (C&I) segment. The T&D segment offers a range of servi

Another decliner set to drop 5% from recent signal close priceMYRG signaled a SELL upon closing the first bar on the 3 hour chart on February 25, 2021. SELL was signaled on five of our algorithms which has never occurred before. In fact the SAG and MTF have never signaled SELL at the same time for this equity on the 3 hour chart either. I have drawn the potent

See all ideas
Trade directly on the supercharts through our supported, fully-verified and user-reviewed brokers.


Curated watchlists where MYRG is featured.

Frequently Asked Questions
The current price of MYRG is 158.35 USD — it has decreased by 0.30% in the past 24 hours.
Depending on the exchange, the stock ticker may vary. For instance, on NASDAQ exchange MYR Group, Inc. stocks are traded under the ticker MYRG.
MYR Group, Inc. is going to release the next earnings report on May 1, 2024. Keep track of upcoming events with our Earnings Calendar.
MYRG stock is 0.30% volatile and has beta coefficient of 1.43. Check out the list of the most volatile stocks — is MYR Group, Inc. there?
One year price forecast for MYR Group, Inc. has a max estimate of 188.00 USD and a min estimate of 165.00 USD.
MYRG earnings for the last quarter are 1.28 USD per share, whereas the estimation was 1.30 USD resulting in a −1.79% surprise. The estimated earnings for the next quarter are 1.50 USD per share. See more details about MYR Group, Inc. earnings.
MYR Group, Inc. revenue for the last quarter amounts to 939.48 M USD despite the estimated figure of 877.48 M USD. In the next quarter revenue is expected to reach 904.76 M USD.
Yes, you can track MYR Group, Inc. financials in yearly and quarterly reports right on TradingView.
MYRG stock has fallen by 6.75% compared to the previous week, the month change is a 1.72% fall, over the last year MYR Group, Inc. has showed a 28.60% increase.
MYRG net income for the last quarter is 24.04 M USD, while the quarter before that showed 21.51 M USD of net income which accounts for 11.76% change. Track more MYR Group, Inc. financial stats to get the full picture.
Today MYR Group, Inc. has the market capitalization of 2.66 B, it has increased by 3.82% over the last week.
No, MYRG doesn't pay any dividends to its shareholders. But don't worry, we've prepared a list of high-dividend stocks for you.
Like other stocks, MYRG shares are traded on stock exchanges, e.g. Nasdaq, Nyse, Euronext, and the easiest way to buy them is through an online stock broker. To do this, you need to open an account and follow a broker's procedures, then start trading. You can trade MYR Group, Inc. stock right from TradingView charts — choose your broker and connect to your account.
As of Apr 19, 2024, the company has 9.00 K employees. See our rating of the largest employees — is MYR Group, Inc. on this list?
Investing in stocks requires a comprehensive research: you should carefully study all the available data, e.g. company's financials, related news, and its technical analysis. So MYR Group, Inc. technincal analysis shows the sell today, and its 1 week rating is buy. Since market conditions are prone to changes, it's worth looking a bit further into the future — according to the 1 month rating MYR Group, Inc. stock shows the buy signal. See more of MYR Group, Inc. technicals for a more comprehensive analysis.
If you're still not sure, try looking for inspiration in our curated watchlists.
If you're still not sure, try looking for inspiration in our curated watchlists.
We've gathered analysts' opinions on MYR Group, Inc. future price: according to them, MYRG price has a max estimate of 188.00 USD and a min estimate of 165.00 USD. Read a more detailed MYR Group, Inc. forecast: see what analysts think of MYR Group, Inc. and suggest that you do with its stocks.
EBITDA measures a company's operating performance, its growth signifies an improvement in the efficiency of a company. MYR Group, Inc. EBITDA is 184.02 M USD, and current EBITDA margin is 5.05%. See more stats in MYR Group, Inc. financial statements.