Looking for an entry LONGthe price has jumped over 38% since OCT, on this weekly timeframe we can see volume is decreasing however price action Sustaining its current value and if you were to compare previous points of time the price was around this range it had a significant move to the upside or downside. In this case ho
0.25USD
42.58 MUSD
2.45 BUSD
139.65 M
About Newmark Group, Inc.
Sector
Industry
CEO
Barry M. Gosin
Website
Headquarters
New York
Employees (FY)
7 K
Founded
1929
ISIN
US65158N1028
FIGI
BBG00J24S765
Newmark Group Inc. engages in the provision of commercial real estate services. It offers its services to commercial real estate tenants, investors, owners, occupiers, developers, leasing and corporate advisory, investment sales and real estate finance, consulting, origination and servicing of commercial mortgage loans, valuation, project and development management and property and facility management. The company was founded in 1929 and is headquartered in New York, NY.

NMRKthere is a support area confluence with trend line and ema 100 u can enter after u see bull pressure and candlestick pattern .
the results of the company's financial information are acceptable :
market cap : 3.48 B
p/e : 5.47
p/s : 1.38
p/b : 2.55
peg : 0.55
Quick Ratio : 1.10
Current Ratio : 1.10

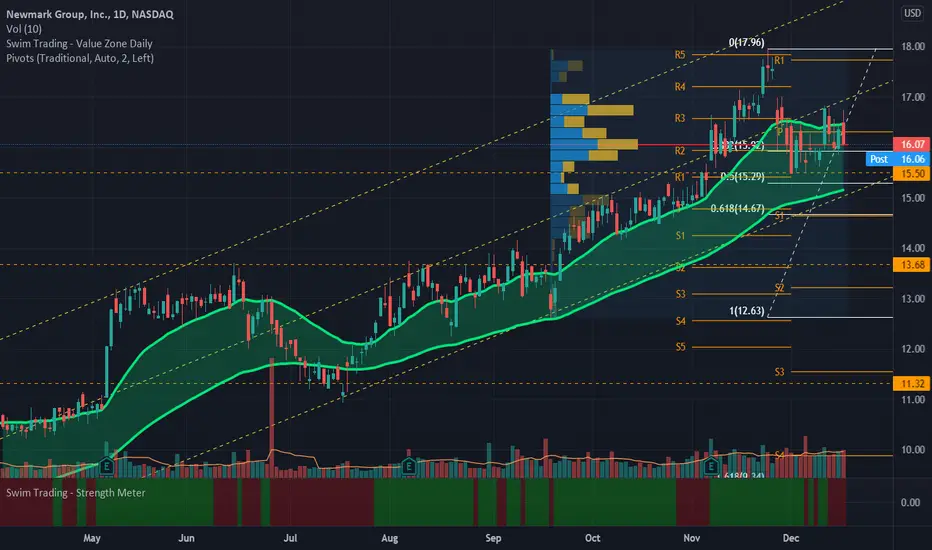
NMRK.NAS_Swim Trading VZ Breakout_LongENTRY: 16.44
SL: 14.83
TP1: 18.35-18.89
- ADX>20
- Maintaining at pivot point "P", 38% fib. and HVN level.
- Strength meter is red hence some weakness.
- Entry based on breakout from VZ today.
NMRK on Road to Create New 52wk HighsNewmark Group, Inc (NMRK) is a commercial real estate advisement firm. They offer a full suite of services for both the owners and tenants. Their client base includes many from Fortune 500 and Forbes Global 2000. They maintained a positive EPS for 2020, and their outlook for 2021/22 is a positive in


See all ideas
Trade directly on the supercharts through our supported, fully-verified and user-reviewed brokers.


Frequently Asked Questions
The current price of NMRK is 9.57 USD — it has decreased by 0.73% in the past 24 hours.
Depending on the exchange, the stock ticker may vary. For instance, on NASDAQ exchange Newmark Group, Inc. stocks are traded under the ticker NMRK.
Newmark Group, Inc. is going to release the next earnings report on May 3, 2024. Keep track of upcoming events with our Earnings Calendar.
NMRK stock is 3.02% volatile and has beta coefficient of 2.95. Check out the list of the most volatile stocks — is Newmark Group, Inc. there?
One year price forecast for Newmark Group, Inc. has a max estimate of 13.00 USD and a min estimate of 11.25 USD.
NMRK earnings for the last quarter are 0.27 USD per share, whereas the estimation was 0.26 USD resulting in a 2.53% surprise. The estimated earnings for the next quarter are 0.47 USD per share. See more details about Newmark Group, Inc. earnings.
Newmark Group, Inc. revenue for the last quarter amounts to 616.28 M USD despite the estimated figure of 606.27 M USD. In the next quarter revenue is expected to reach 743.53 M USD.
Yes, you can track Newmark Group, Inc. financials in yearly and quarterly reports right on TradingView.
NMRK stock has fallen by 7.00% compared to the previous week, the month change is a 10.06% fall, over the last year Newmark Group, Inc. has showed a 50.47% increase.
NMRK net income for the last quarter is 36.55 M USD, while the quarter before that showed 9.95 M USD of net income which accounts for 267.43% change. Track more Newmark Group, Inc. financial stats to get the full picture.
Today Newmark Group, Inc. has the market capitalization of 1.66 B, it has increased by 3.66% over the last week.
Yes, NMRK dividends are paid quarterly. The last dividend per share was 0.03 USD. As of today, Dividend Yield (TTM)% is 1.24%. Tracking Newmark Group, Inc. dividends might help you take more informed decisions.
Newmark Group, Inc. dividend yield was 1.09% in 2023, and payout ratio reached 49.71%. The year before the numbers were 1.25% and 22.21% correspondingly. See high-dividend stocks and find more opportunities for your portfolio.
Like other stocks, NMRK shares are traded on stock exchanges, e.g. Nasdaq, Nyse, Euronext, and the easiest way to buy them is through an online stock broker. To do this, you need to open an account and follow a broker's procedures, then start trading. You can trade Newmark Group, Inc. stock right from TradingView charts — choose your broker and connect to your account.
As of Apr 19, 2024, the company has 7.00 K employees. See our rating of the largest employees — is Newmark Group, Inc. on this list?
Investing in stocks requires a comprehensive research: you should carefully study all the available data, e.g. company's financials, related news, and its technical analysis. So Newmark Group, Inc. technincal analysis shows the sell today, and its 1 week rating is sell. Since market conditions are prone to changes, it's worth looking a bit further into the future — according to the 1 month rating Newmark Group, Inc. stock shows the buy signal. See more of Newmark Group, Inc. technicals for a more comprehensive analysis.
If you're still not sure, try looking for inspiration in our curated watchlists.
If you're still not sure, try looking for inspiration in our curated watchlists.
We've gathered analysts' opinions on Newmark Group, Inc. future price: according to them, NMRK price has a max estimate of 13.00 USD and a min estimate of 11.25 USD. Read a more detailed Newmark Group, Inc. forecast: see what analysts think of Newmark Group, Inc. and suggest that you do with its stocks.
EBITDA measures a company's operating performance, its growth signifies an improvement in the efficiency of a company. Newmark Group, Inc. EBITDA is 291.89 M USD, and current EBITDA margin is 11.30%. See more stats in Newmark Group, Inc. financial statements.