NTRB longNTRB Long🚀📊
It is not financial advice. This is my opinion. Please check yourselves and invest in the symbols that you think have a huge potential to reach the best results.
Please leave us your opinion and reviews.🙏
Next report date
Report period
Q4 2023
EPS estimate
—
Revenue estimate
—
−0.67USD
−4.48 MUSD
2.08 MUSD
3.73 M
About Nutriband Inc.
Sector
Industry
CEO
Gareth R. Sheridan
Website
Headquarters
Orlando
Founded
2012
FIGI
BBG00GSMQF58
Nutriband, Inc. engages in the development of a portfolio of transdermal pharmaceutical products. It operates through the Pocono Pharmaceuticals and 4P Therapeutics segments. The Pocono Pharmaceuticals segment relates to a coated products manufacturing entity. The 4P Therapeutics segment performs contract research and development services. The company was founded by Gareth R. Sheridan and Serguei Melnik in 2012 and is headquartered in Orlando, FL.

NUTRIBAND - NTRB targets with Fibonacci Circle and PitchforkNUTRIBAND - NTRB targets with Fibonacci Circle and Pitchfork, the targets are on the top right. Top target at $30 at the Fibonacci circle above the pitchfork
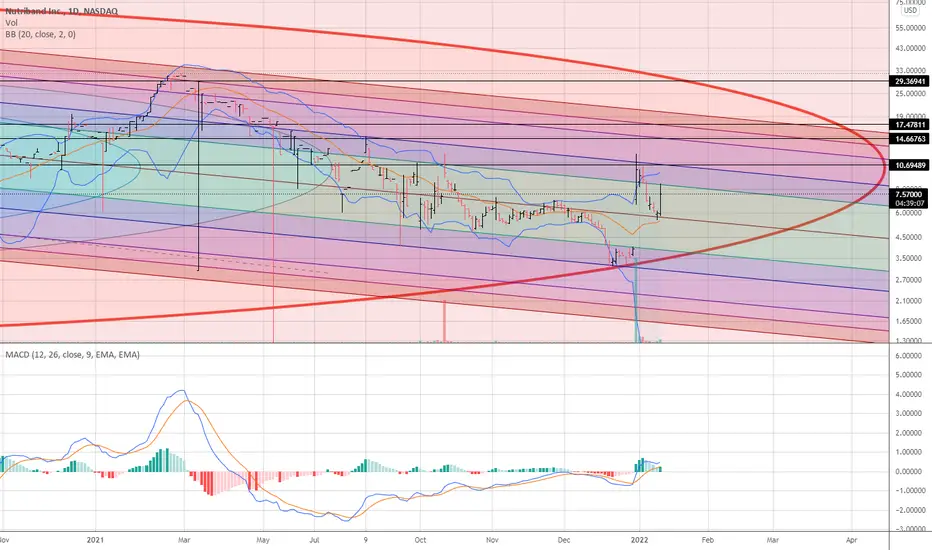
NTRB just make a new uptrend impulse Volume Ratio indicator ( VR value 9 ) almost 10 indicate the new trend is confrim base on VR value range
1-3 = initial phase ( breakout buying interest )
4-6 = medium phase ( breakout buying and selling pressure has start for same day )
7-10 = final phase ( breakout buying and selling pressure m

See all ideas
Trade directly on the supercharts through our supported, fully-verified and user-reviewed brokers.


Frequently Asked Questions
The current price of NTRB is 3.65 USD — it has decreased by 5.19% in the past 24 hours.
Depending on the exchange, the stock ticker may vary. For instance, on NASDAQ exchange Nutriband Inc. stocks are traded under the ticker NTRB.
Nutriband Inc. is going to release the next earnings report on Apr 26, 2024. Keep track of upcoming events with our Earnings Calendar.
NTRB stock is 6.32% volatile and has beta coefficient of 1.77. Check out the list of the most volatile stocks — is Nutriband Inc. there?
Nutriband Inc. revenue for the last quarter amounts to 620.00 K USD despite the estimated figure of 584.72 K USD. In the next quarter revenue is expected to reach 675.00 K USD.
Yes, you can track Nutriband Inc. financials in yearly and quarterly reports right on TradingView.
NTRB stock has fallen by 12.68% compared to the previous week, the month change is a 34.69% rise, over the last year Nutriband Inc. has showed a 5.18% increase.
NTRB net income for the last quarter is −1.76 M USD, while the quarter before that showed −829.17 K USD of net income which accounts for −112.25% change. Track more Nutriband Inc. financial stats to get the full picture.
Today Nutriband Inc. has the market capitalization of 30.16 M, it has decreased by 11.72% over the last week.
No, NTRB doesn't pay any dividends to its shareholders. But don't worry, we've prepared a list of high-dividend stocks for you.
Like other stocks, NTRB shares are traded on stock exchanges, e.g. Nasdaq, Nyse, Euronext, and the easiest way to buy them is through an online stock broker. To do this, you need to open an account and follow a broker's procedures, then start trading. You can trade Nutriband Inc. stock right from TradingView charts — choose your broker and connect to your account.
Investing in stocks requires a comprehensive research: you should carefully study all the available data, e.g. company's financials, related news, and its technical analysis. So Nutriband Inc. technincal analysis shows the neutral today, and its 1 week rating is buy. Since market conditions are prone to changes, it's worth looking a bit further into the future — according to the 1 month rating Nutriband Inc. stock shows the sell signal. See more of Nutriband Inc. technicals for a more comprehensive analysis.
If you're still not sure, try looking for inspiration in our curated watchlists.
If you're still not sure, try looking for inspiration in our curated watchlists.
EBITDA measures a company's operating performance, its growth signifies an improvement in the efficiency of a company. Nutriband Inc. EBITDA is −4.62 M USD, and current EBITDA margin is −181.71%. See more stats in Nutriband Inc. financial statements.