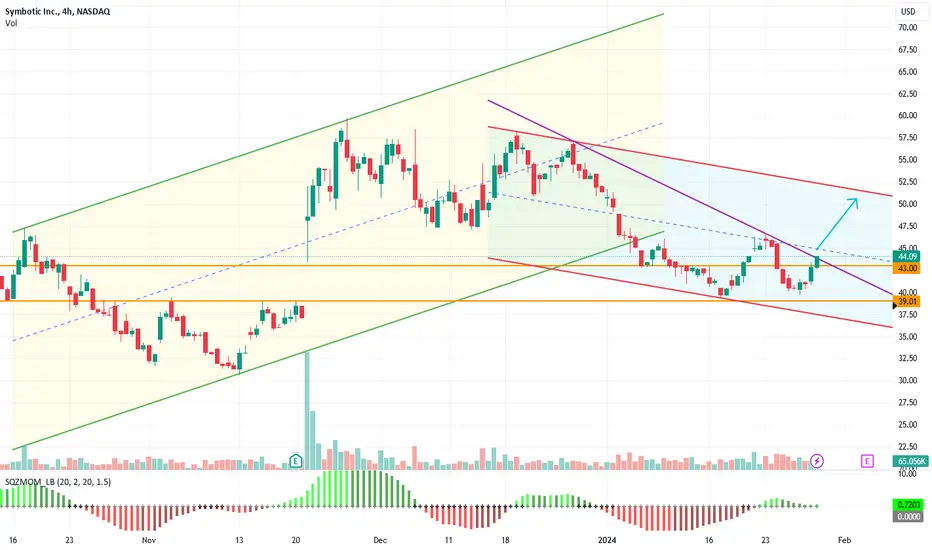
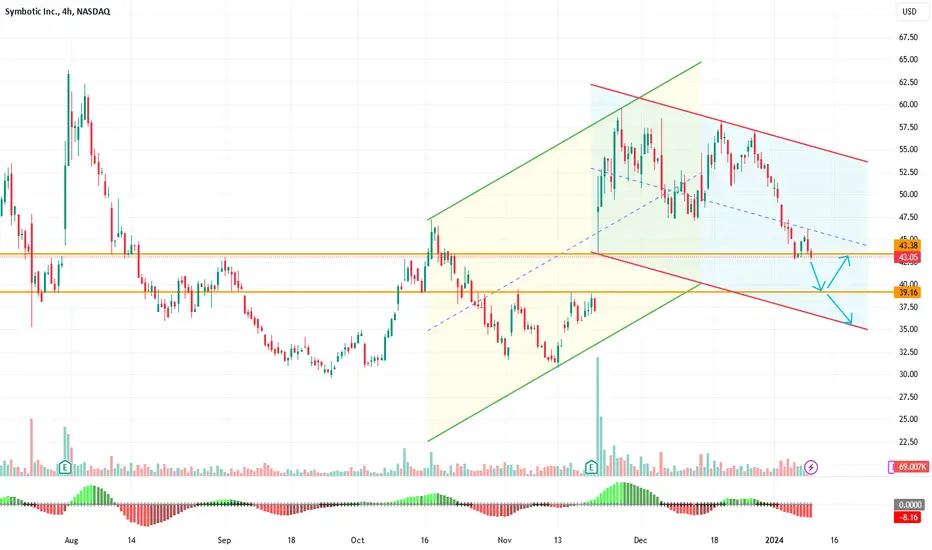
SYM: Quietly Building a Base — Is a Breakout Brewing?Sometimes the most interesting setups aren't the ones already running.
They're the ones building quietly before the crowd arrives.
SYM has spent months stabilizing after a prolonged decline, with price repeatedly finding buyers around the $39–40 support zone.
Meanwhile, momentum is starting to te
Symbotic Inc.
No trades
No trades
Compare with Symbotic Inc.
0.10 USD
−16.94 M USD
2.25 B USD
68.43 M
Next report date
—
Report period
—
EPS estimate
—
Revenue estimate
—
Company info
Sector
Industry
CEO
Richard B. Cohen
Website
Headquarters
Wilmington
Founded
2020
IPO date
Mar 9, 2021
ISIN
US87151X1019
CUSIP
87151X101
FIGI
BBG00Z72HCV1
Identifiers
ISIN US87151X1019
Symbotic, Inc. is an automation technology company, which engages in a robotics and automation-based product movement technology platform. It focuses on developing, commercializing, and deploying innovative, end-to-end technology solutions for supply chain operations. It operates through the United States and Canada geographical segments. The company was founded by Richard B. Cohen on December 11, 2020 and is headquartered in Wilmington, MA.
AI-Robotics Leader Testing Major Support | $68–$85 TargetSymbotic has experienced a significant correction after reaching approximately $88 and is now testing an important long-term accumulation area.
SYM develops AI-powered robotics and software used to automate warehouses and supply-chain operations. Its technology is designed to improve warehouse spee
Symbotic Inc.: A High-Probability Test of the 0.618 Golden RatioSymbotic Inc. (NASDAQ: SYM) has pulled back into the 0.618 Fibonacci retracement, also known as the Golden Ratio, one of the most closely watched levels for potential Wave (2) completions in Elliott Wave analysis.
After a strong impulsive advance, this retracement appears to be developing as a larg
$SYM: When Walmart pays you to automate WalmartLogistics was long considered a boring business. Then came robots, artificial intelligence and Symbotic. Today the company builds not just warehouses but a full scale operating system for the world‘s largest retailers, where the movement of every box is calculated by algorithms faster than a human c
Buying SymboticTrading Fam,
I am also entering Symbotic here. My Pivot Zones Indicator is showing we are in a large demand zone. It also fired a BUY signal inside of this demand zone a few days ago! Further confirmation. Additionally, you can see we are using that 350 day SMA as strong support and have already
$SYM , SetupENTRY : CMP
TP : All the levels on the chart, tight management
SL: If you wish (huge dump possible if it gets bellow the SL on the chart)
My SL is never a SELL sign, just an alarm to stop adding money and wait for better dca
Follow, Boost, Thank You !!
⚠️ Financial Disclaimer:
This post is not
The Crab; Written on the Walls.Today Im keeping an eye on RSI until EOY. We are sitting in a sort of "awkward" spot which leaves the security neither over sold, nor overbought, the crab continues around $61, which is within my guesstimated bounds per last idea.
With our new support seemingly found, it may be a good idea to slow
A Crabby Winter? New Highs, New and Old SupportLet's keep it short and a bit elementary.
Last time Symbotic printed their ATH at closing, we saw months of "sideways" trading, forming a channel and eventually breaking through, downwards, due to a multitude of things. I mentioned this early August or so.
ibb.co
I believe with the recent surge
SYM watch $80.xx: Golden zone could TOP or POP for a BIG MOVESYM got a nice surge off its last Earnings report.
It has spiked into a Dual Golden fibs at $79.98-80.34
Looking for a Break-n-Retest to launch next leg up.
.
Previous Plot that caught a PERFECT BOTTOM:
Hit BOOST and FOLLOW for more such PRECISE and TIMELY charts.
===============================
See all ideas
Summarizing what the indicators are suggesting.
Neutral
SellBuy
Strong sellStrong buy
Strong sellSellNeutralBuyStrong buy
Neutral
SellBuy
Strong sellStrong buy
Strong sellSellNeutralBuyStrong buy
Neutral
SellBuy
Strong sellStrong buy
Strong sellSellNeutralBuyStrong buy
An aggregate view of professional's ratings.
Neutral
SellBuy
Strong sellStrong buy
Strong sellSellNeutralBuyStrong buy
Neutral
SellBuy
Strong sellStrong buy
Strong sellSellNeutralBuyStrong buy
Neutral
SellBuy
Strong sellStrong buy
Strong sellSellNeutralBuyStrong buy
Displays a symbol's price movements over previous years to identify recurring trends.
Frequently asked questions
The current price of SYM is 42.77 USD — it has increased by 2.81% in the past 24 hours. Watch Symbotic Inc. stock price performance more closely on the chart.
Depending on the exchange, the stock ticker may vary. For instance, on NASDAQ exchange Symbotic Inc. stocks are traded under the ticker SYM.
SYM stock has fallen by −0.96% compared to the previous week, the month change is a 1.82% rise, over the last year Symbotic Inc. has showed a −10.69% decrease.
We've gathered analysts' opinions on Symbotic Inc. future price: according to them, SYM price has a max estimate of 85.00 USD and a min estimate of 38.00 USD. Watch SYM chart and read a more detailed Symbotic Inc. stock forecast: see what analysts think of Symbotic Inc. and suggest that you do with its stocks.
SYM stock is 3.87% volatile and has beta coefficient of 2.70. Track Symbotic Inc. stock price on the chart and check out the list of the most volatile stocks — is Symbotic Inc. there?
Today Symbotic Inc. has the market capitalization of 5.55 B, it has decreased by −5.89% over the last week.
Yes, you can track Symbotic Inc. financials in yearly and quarterly reports right on TradingView.
Symbotic Inc. is going to release the next earnings report on Nov 23, 2026. Keep track of upcoming events with our Earnings Calendar.
SYM earnings for the last quarter are 0.09 USD per share, whereas the estimation was 0.13 USD resulting in a −31.36% surprise. The estimated earnings for the next quarter are 0.07 USD per share. See more details about Symbotic Inc. earnings.
Symbotic Inc. revenue for the last quarter amounts to 720.84 M USD, despite the estimated figure of 715.03 M USD. In the next quarter, revenue is expected to reach 776.14 M USD.
SYM net income for the last quarter is 11.67 M USD, while the quarter before that showed 1.97 M USD of net income which accounts for 0.00% change. Track more Symbotic Inc. financial stats to get the full picture.
No, SYM doesn't pay any dividends to its shareholders. But don't worry, we've prepared a list of high-dividend stocks for you.
As of Sep 16, 2026, the company has 2 K employees. See our rating of the largest employees — is Symbotic Inc. on this list?
EBITDA measures a company's operating performance, its growth signifies an improvement in the efficiency of a company. Symbotic Inc. EBITDA is 82.09 M USD, and current EBITDA margin is −1.66%. See more stats in Symbotic Inc. financial statements.
Like other stocks, SYM shares are traded on stock exchanges, e.g. Nasdaq, Nyse, Euronext, and the easiest way to buy them is through an online stock broker. To do this, you need to open an account and follow a broker's procedures, then start trading. You can trade Symbotic Inc. stock right from TradingView charts — choose your broker and connect to your account.
Investing in stocks requires a comprehensive research: you should carefully study all the available data, e.g. company's financials, related news, and its technical analysis. So Symbotic Inc. technincal analysis shows the buy rating today, and its 1 week rating is sell. Since market conditions are prone to changes, it's worth looking a bit further into the future — according to the 1 month rating Symbotic Inc. stock shows the neutral signal. See more of Symbotic Inc. technicals for a more comprehensive analysis.