"SWIM: Double Bottom Breakout Signals 80% Return Potential!"SWIM Stock: Double Bottom Breakout Signals Potential 80% Returns in Producer Manufacturing Industry
SWIM stock, a prominent player in the producer manufacturing industry, is on the brink of a significant breakthrough as it forms a double bottom pattern. With the potential for a breakout back to $4
−0.02USD
−2.39 MUSD
566.49 MUSD
36.75 M
About Latham Group, Inc.
Sector
Industry
CEO
Scott M. Rajeski
Website
Headquarters
Latham
Employees (FY)
1.76 K
Founded
2018
ISIN
US51819L1070
FIGI
BBG00ZVXLHH6
Latham Group, Inc. operates as a designer, manufacturer, and marketer of in-ground residential swimming pools in North America, Australia, and New Zealand. It offers a portfolio of pools and related products, including in-ground swimming pools, pool liners, and pool covers. The company was founded on December 6, 2018 and is headquartered in Latham, NY.

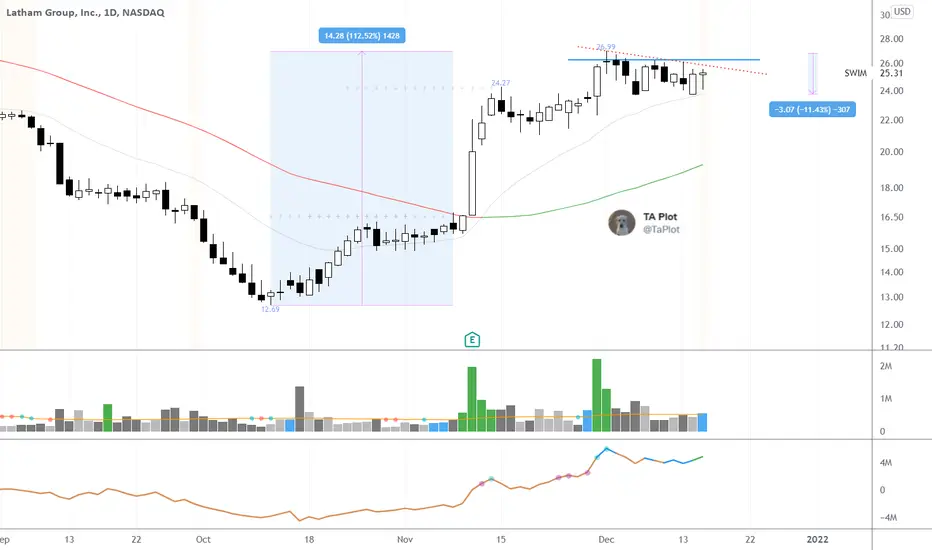
SWIM - Breaking OutSwim is positioned nicely to take advantage of the rise in interest rates as clients are moving away from the inflated prices of concrete swimming pools and downsizing to the speed and lower cost of fiberglass pools. They have made multiple moves to handle capacity issues they dealt with in the cov

1000% potential gain 1000% potential gain is what this stock can make to us only if goes back to ATH!
This crises will be history one day and now is the best moment to buy good companies at this price level.

3rd TestIt has just completed the 3rd bounce off a double bottom. In my experience this usually causes an accelerated move to the upside.

$SWIM Looks Very Strong$SWIM up 112% in short period of time and gave up less than 12% of that in a touch market.
That is strength.
Quite a few things coming together here. on Primary watchlist.

$SWIM Keep and eye on this one this week!Hey guys found a clean Gartley pattern in swim, I listed all triggers bc there is 3 in the Gartley pattern, 786 ext and 1.212 are both touched off, watch the lower level trigger 3 or abcd level which is still not hit, this can make a big move, I listed targets and stop loss as well, tp1 pls move sto

$SWI M is giving a GREAT IPO LONG opportunity todayIPO intraday trading strategy idea
Latham Group specializes in fiberglass residential in-ground swimming pools, which can be installed more quickly than an in-ground concrete pool.
The share price is rising and gonna continue this trend today.
The demand for shares of the company still looks high

See all ideas
Trade directly on the supercharts through our supported, fully-verified and user-reviewed brokers.


Frequently Asked Questions
The current price of SWIM is 3.10 USD — it has decreased by 2.52% in the past 24 hours.
Depending on the exchange, the stock ticker may vary. For instance, on NASDAQ exchange Latham Group, Inc. stocks are traded under the ticker SWIM.
Latham Group, Inc. is going to release the next earnings report on May 7, 2024. Keep track of upcoming events with our Earnings Calendar.
SWIM stock is 4.06% volatile and has beta coefficient of 3.00. Check out the list of the most volatile stocks — is Latham Group, Inc. there?
One year price forecast for Latham Group, Inc. has a max estimate of 5.00 USD and a min estimate of 2.50 USD.
SWIM earnings for the last quarter are 0.11 USD whereas the estimation was 0.12 USD which accounts for −9.66% surprise. Estimated earnings for the next quarter are −0.06 USD. See more details about Latham Group, Inc. earnings.
Latham Group, Inc. revenue for the last quarter amounts to 160.80 M USD despite the estimated figure of 163.05 M USD. In the next quarter revenue is expected to reach 86.95 M USD.
Yes, you can track Latham Group, Inc. financials in yearly and quarterly reports right on TradingView.
SWIM stock has fallen by 9.36% compared to the previous week, the month change is a 10.14% fall, over the last year Latham Group, Inc. has showed a 30.80% increase.
SWIM net income for the last quarter is 111.00 K USD, while the quarter before that showed 6.15 M USD of net income which accounts for −98.20% change. Track more Latham Group, Inc. financial stats to get the full picture.
Today Latham Group, Inc. has the market capitalization of 366.93 M, it has decreased by 1.10% over the last week.
No, SWIM doesn't pay any dividends to its shareholders. But don't worry, we've prepared a list of high-dividend stocks for you.
Like other stocks, SWIM shares are traded on stock exchanges, e.g. Nasdaq, Nyse, Euronext, and the easiest way to buy them is through an online stock broker. To do this, you need to open an account and follow a broker's procedures, then start trading. You can trade Latham Group, Inc. stock right from TradingView charts — choose your broker and connect to your account.
As of Apr 18, 2024, the company has 1.76 K employees. See our rating of the largest employees — is Latham Group, Inc. on this list?
Investing in stocks requires a comprehensive research: you should carefully study all the available data, e.g. company's financials, related news, and its technical analysis. So Latham Group, Inc. technincal analysis shows the sell today, and its 1 week rating is neutral. Since market conditions are prone to changes, it's worth looking a bit further into the future — according to the 1 month rating Latham Group, Inc. stock shows the sell signal. See more of Latham Group, Inc. technicals for a more comprehensive analysis.
If you're still not sure, try looking for inspiration in our curated watchlists.
If you're still not sure, try looking for inspiration in our curated watchlists.
We've gathered analysts' opinions on Latham Group, Inc. future price: according to them, SWIM price has a max estimate of 5.00 USD and a min estimate of 2.50 USD. Read a more detailed Latham Group, Inc. forecast: see what analysts think of Latham Group, Inc. and suggest that you do with its stocks.
EBITDA measures a company's operating performance, its growth signifies an improvement in the efficiency of a company. Latham Group, Inc. EBITDA is 67.39 M USD, and current EBITDA margin is 10.86%. See more stats in Latham Group, Inc. financial statements.