VNOM testing key resistanceViper Energy (VNOM) presently testing key resistance, able to absorb weekly buying pressures.
From here, (VNOM) is susceptible to falling back to recent support, eliciting losses of 10% over the following 1 - 2 months, and potentially losses of 20 - 30% over the following 3 - 5 months.
Inversely
2.70USD
199.79 MUSD
717.11 MUSD
80.87 M
About Viper Energy, Inc.
Sector
Industry
CEO
Travis D. Stice
Website
Headquarters
Midland
Founded
2014
ISIN
US9279591062
FIGI
BBG006G57XG0
Viper Energy, Inc. engages in the acquisition of oil and natural gas properties. It owns, acquires, and exploits oil and natural gas properties in North America. The company was founded on February 27, 2014 and is headquartered in Midland, TX.

$VNOM - 10% DividendThis guy has a 10% Dividend with expected sales growth over the next 5 years! Dividends paid quarterly. On my permanent watch list for the fundamental watch looking for some possible dips to take advantage of the dividends,

BREAKING DIVERGENCEBullish momentum has build up during today's session, confirming the positive divergence over fibonacci level, now longs should have a 1.6 R/R

VNOM bearish or breakoutVNOM is at the resistance zone and forms a bearish pin bar. Could retest the nearest support upon breaking low.

Viper Energy Announces Increased Authorization of Common Unit ReVNOM: Viper Energy Partners LP
2021-11-15 16:01:00
Viper Energy Partners LP, a Subsidiary of Diamondback Energy, Inc., Announces Increased Authorization of Common Unit Repurchase Program

Viper Energy Partners (VNOM) - HODLING LONG & STRONGViper Energy Partners (VNOM) - Long this hydrocarbon producer starting Spring 2021 on anticipated inflationary pressures driving hydrocarbon energy such as oil and natural gas higher, along with legacy hydrocarbon ("fossil fuel") exploration & production companies higher. Now riding the global energ


potential breakout/ watch $15Viper Energy Partners LP engages in the acquisition of oil and natural gas properties. It owns, acquires, and exploits oil and natural gas properties in North America.
Please note: I'm just sharing my view. its not a recommendation for buying or selling.

VNOM BIDEN ClampOil Looking Good again under Biden Admin Regulations to drive price up. keep thing a bit tapered down. good for overall energy sector for now.. until.. he unleashes Iran back onto the market sending price back down..
well hoping he has more on his to do list then cozying up with our Enemy. maybe oil

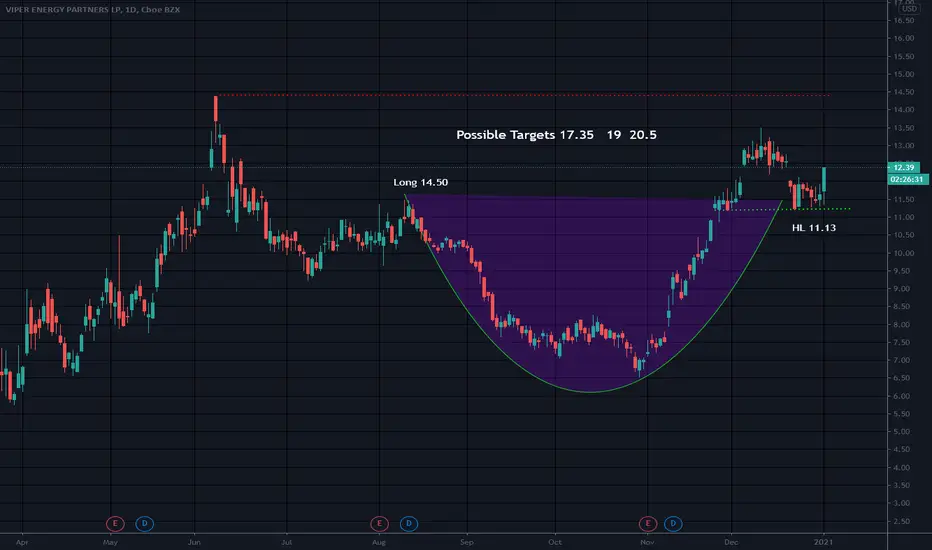
Cup and HandlePattern valid over long entry level..
Mid cup is 10.45 Handle low is 11.13 Cup low is 6.52 Cup depth is 7.86
Not a recommendation.
See all ideas
Trade directly on the supercharts through our supported, fully-verified and user-reviewed brokers.


Frequently Asked Questions
The current price of VNOM is 39.45 USD — it has increased by 1.35% in the past 24 hours.
Depending on the exchange, the stock ticker may vary. For instance, on NASDAQ exchange Viper Energy, Inc. stocks are traded under the ticker VNOM.
Viper Energy, Inc. is going to release the next earnings report on Apr 30, 2024. Keep track of upcoming events with our Earnings Calendar.
VNOM stock is 1.53% volatile and has beta coefficient of 0.29. Check out the list of the most volatile stocks — is Viper Energy, Inc. there?
One year price forecast for Viper Energy, Inc. has a max estimate of 52.00 USD and a min estimate of 34.00 USD.
VNOM earnings for the last quarter are 1.10 USD per share, whereas the estimation was 0.48 USD resulting in a 127.50% surprise. The estimated earnings for the next quarter are 0.48 USD per share. See more details about Viper Energy, Inc. earnings.
Viper Energy, Inc. revenue for the last quarter amounts to 293.24 M USD despite the estimated figure of 199.43 M USD. In the next quarter revenue is expected to reach 204.61 M USD.
Yes, you can track Viper Energy, Inc. financials in yearly and quarterly reports right on TradingView.
VNOM stock has fallen by 3.79% compared to the previous week, the month change is a 5.64% rise, over the last year Viper Energy, Inc. has showed a 34.85% increase.
VNOM net income for the last quarter is 56.94 M USD, while the quarter before that showed 78.45 M USD of net income which accounts for −27.43% change. Track more Viper Energy, Inc. financial stats to get the full picture.
Today Viper Energy, Inc. has the market capitalization of 3.35 B, it has increased by 2.97% over the last week.
Yes, VNOM dividends are paid quarterly. The last dividend per share was 0.56 USD. As of today, Dividend Yield (TTM)% is 4.68%. Tracking Viper Energy, Inc. dividends might help you take more informed decisions.
Viper Energy, Inc. dividend yield was 5.58% in 2023, and payout ratio reached 64.97%. The year before the numbers were 7.68% and 122.04% correspondingly. See high-dividend stocks and find more opportunities for your portfolio.
Like other stocks, VNOM shares are traded on stock exchanges, e.g. Nasdaq, Nyse, Euronext, and the easiest way to buy them is through an online stock broker. To do this, you need to open an account and follow a broker's procedures, then start trading. You can trade Viper Energy, Inc. stock right from TradingView charts — choose your broker and connect to your account.
Investing in stocks requires a comprehensive research: you should carefully study all the available data, e.g. company's financials, related news, and its technical analysis. So Viper Energy, Inc. technincal analysis shows the buy rating today, and its 1 week rating is buy. Since market conditions are prone to changes, it's worth looking a bit further into the future — according to the 1 month rating Viper Energy, Inc. stock shows the buy signal. See more of Viper Energy, Inc. technicals for a more comprehensive analysis.
If you're still not sure, try looking for inspiration in our curated watchlists.
If you're still not sure, try looking for inspiration in our curated watchlists.
We've gathered analysts' opinions on Viper Energy, Inc. future price: according to them, VNOM price has a max estimate of 52.00 USD and a min estimate of 34.00 USD. Read a more detailed Viper Energy, Inc. forecast: see what analysts think of Viper Energy, Inc. and suggest that you do with its stocks.
EBITDA measures a company's operating performance, its growth signifies an improvement in the efficiency of a company. Viper Energy, Inc. EBITDA is 655.75 M USD, and current EBITDA margin is 91.49%. See more stats in Viper Energy, Inc. financial statements.